Introduction: Why Should You Learn to Read Charts and Candlesticks?
In the world of finance and investing, knowledge is power. The ability to read charts and candlesticks is one of the most important tools an investor can possess. These visual tools enable you to understand market behavior, identify trends, and make smarter investment decisions. Whether you're a day trader or a long-term investor, mastering these skills will give you a significant competitive advantage.
Imagine trying to drive a car blindfolded. That's the situation of an investor who makes decisions without understanding charts. Charts and candlesticks are like the dashboard that shows you the market's speed (volatility), the direction it's heading (trends), and potential obstacles (support and resistance levels).
Chapter 1: Basics of Charts
What are Charts?
A chart is a visual representation of the price movement of a financial asset (such as stocks, currencies, or commodities) over time. Charts typically consist of two axes: the horizontal axis represents time, and the vertical axis represents price.
Common Types of Charts:
- Line Chart: Connects price points with a single line, giving a simple overview of price movement.
- Bar Chart: Shows the open, close, high, and low prices for a specific time period.
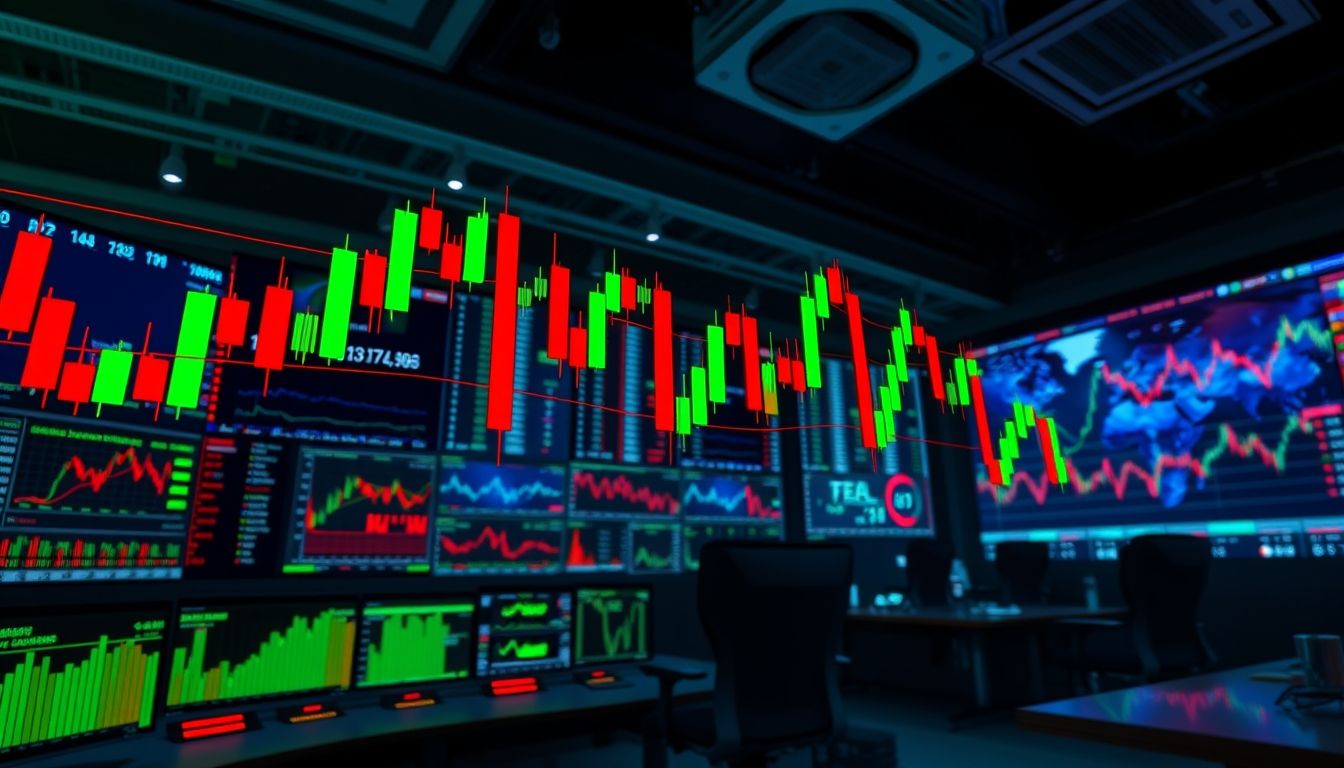
- Candlestick Chart: The most common type, it displays the same information as a bar chart, but in a more readable format, where each time period is represented by a candlestick.
Example: Let's say you are trading Saudi Aramco stock. You can use a daily chart (each candlestick represents one trading day) to monitor the stock's price movement over the past few months. You can also use a weekly chart (each candlestick represents one trading week) to get a broader view of the long-term trend.
Chapter 2: Introduction to Candlesticks
What are Candlesticks?
Candlesticks are a powerful tool for chart analysis, originating in Japan in the 18th century. Each candlestick consists of two main parts:
- Body: Represents the difference between the open and close price. If the close price is higher than the open price, the body is usually green or white (bullish candlestick). If the close price is lower than the open price, the body is usually red or black (bearish candlestick).
- Wick/Shadow: Represents the highest and lowest price reached during the time period.
Importance of Candlestick Colors:
The color of the candlestick gives immediate information about price movement. A green candlestick indicates buying pressure (price went up), and a red candlestick indicates selling pressure (price went down).
Chapter 3: Common Candlestick Patterns
There are many candlestick patterns that can indicate potential reversals or continuations of a trend. It's important to note that these patterns are not guaranteed, but they provide valuable signals.
Bullish Reversal Patterns:
- Hammer: A candlestick with a small body and a long lower wick at the end of a downtrend, indicating a potential trend reversal.
- Inverted Hammer: A candlestick with a small body and a long upper shadow at the end of a downtrend, indicating a potential trend reversal.
- Bullish Engulfing: A green candlestick that engulfs the previous red candlestick, indicating strong buying pressure.
- Morning Star: A three-candlestick pattern that indicates a bullish trend reversal, consisting of a large red candlestick, then a small candlestick (usually a doji), then a large green candlestick.
Bearish Reversal Patterns:
- Hanging Man: A candlestick with a small body and a long lower wick at the end of an uptrend, indicating a potential trend reversal.
- Shooting Star: A candlestick with a small body and a long upper shadow at the end of an uptrend, indicating a potential trend reversal.
- Bearish Engulfing: A red candlestick that engulfs the previous green candlestick, indicating strong selling pressure.
- Evening Star: A three-candlestick pattern that indicates a bearish trend reversal, consisting of a large green candlestick, then a small candlestick (usually a doji), then a large red candlestick.
Warning: Do not rely on a single candlestick pattern to make an investment decision. Look for confirmation from other technical indicators or fundamental analysis.
Chapter 4: Support and Resistance
What are Support and Resistance Levels?
Support and resistance levels are areas on a chart where the price tends to pause or reverse. A support level is a price level where the price is expected to have difficulty falling below, while a resistance level is a price level where the price is expected to have difficulty rising above.
How to Identify Support and Resistance Levels:
- Previous Highs and Lows: Previous highs and lows often act as support and resistance levels.
- Trendlines: Upward trendlines can act as support, and downward trendlines can act as resistance.
- Fibonacci Levels: Fibonacci levels are used to identify potential support and resistance levels based on Fibonacci ratios.
Importance of Support and Resistance Levels:
Support and resistance levels help traders identify potential buying and selling areas, and set stop-loss points and profit targets.
Chapter 5: Trendlines
What are Trendlines?
Trendlines are straight lines that connect a series of highs or lows on a chart. Trendlines are used to identify the direction of the market.
Types of Trendlines:
- Uptrend Line: Connects a series of increasing lows, indicating an uptrend.
- Downtrend Line: Connects a series of decreasing highs, indicating a downtrend.
- Horizontal Trendline: Indicates a sideways or neutral trend.
How to Use Trendlines:
Trendlines can be used to identify potential entry and exit points in the market. Traders often look for buying opportunities near an upward trendline, and selling opportunities near a downward trendline.
Chapter 6: Technical Indicators
Technical indicators are mathematical calculations based on price and volume data. Technical indicators are used to identify and confirm trends, identify potential support and resistance levels, and generate buy and sell signals.
Examples of Common Technical Indicators:
- Moving Averages: Calculate the average price of a financial asset over a specific time period.
- Relative Strength Index (RSI): Measures the speed and change of price movements.
- Moving Average Convergence Divergence (MACD): Shows the relationship between two moving averages of prices.
- Bollinger Bands: Measure market volatility.
How to Use Technical Indicators:
Technical indicators can be used to confirm candlestick signals and other chart patterns. For example, if a bullish reversal pattern appears near a support level, and the RSI indicates that the financial asset is in an oversold area, it could be a strong buy signal.
Chapter 7: Volume
What is Volume?
Volume is the number of shares or contracts traded in a specific time period. Volume is an important indicator of the strength of a trend.
How to Use Volume:
- Trend Confirmation: An uptrend should be supported by increasing volume, and a downtrend should be supported by increasing volume.
- Breakout Confirmation: Breakouts above resistance levels or below support levels should be supported by increasing volume.
- Potential Reversal Detection: Decreasing volume at the end of a trend can indicate a potential reversal.
Chapter 8: Risk Management
Risk management is an essential part of trading and investing. It is important to determine the amount of risk you are willing to take before entering any trade.
Risk Management Tools:
- Stop-Loss Orders: Set the maximum loss you are willing to tolerate on a trade.
- Position Sizing: Determines the number of shares or contracts to buy or sell based on the size of your account and your risk tolerance.
- Diversification: Spreading your investments across a variety of assets to reduce risk.
Chapter 9: Trading Strategies Using Charts and Candlesticks
After understanding the basics of charts and candlesticks, you can start developing your own trading strategies. Here are some examples:
- Trend Following: Identifying the prevailing trend in the market and entering trades that align with that trend.
- Counter-Trend Trading: Looking for opportunities to buy when the market is oversold, and sell when the market is overbought.
- Breakout Trading: Entering trades when the price breaks above a resistance level or falls below a support level.
Important: Test your trading strategies on a demo account before risking real money.
Chapter 10: Tips for Traders and Investors
- Practice Consistently: The more you practice reading charts and candlesticks, the better you will become at it.
- Be Patient: Don't expect to become an expert overnight.
- Learn from Mistakes: Use your mistakes as opportunities to learn and improve.
- Stay Informed: Follow financial news and analysis to stay up-to-date on market events.
- Keep Learning: The world of finance and investing is constantly changing. Continue to learn new strategies and techniques.
Disclaimer: This article is for educational and informational purposes only, and should not be considered investment advice. Trading and investing involves risk, and you may lose money. Consult with a qualified financial advisor before making any investment decisions.


