Introduction to Bollinger Bands
Bollinger Bands are a technical analysis tool used to identify overbought and oversold levels in the market. Developed by John Bollinger in the 1980s, they consist of three lines:
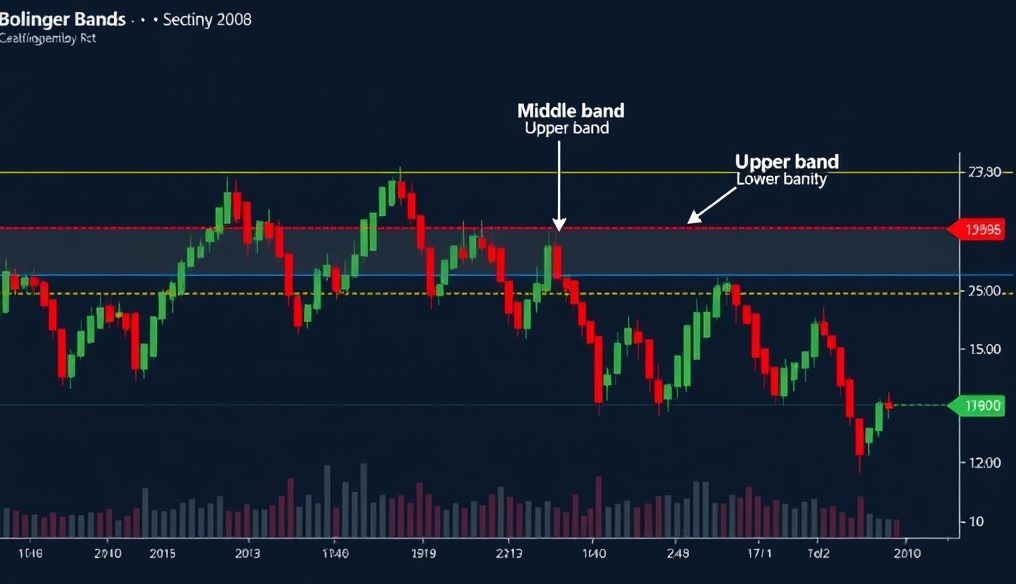
- Middle Band: Usually a simple moving average (SMA) over a specified period (often 20 days).
- Upper Band: Represents one or two standard deviations above the middle band.
- Lower Band: Represents one or two standard deviations below the middle band.
The basic idea is that the price of an asset tends to stay within the range between the upper and lower bands. When the price approaches the upper band, the market is considered overbought, and when it approaches the lower band, it is considered oversold.
Chapter 1: Understanding the Components of Bollinger Bands
To understand how to use Bollinger Bands effectively, it is essential to understand its basic components:
Middle Band (Moving Average)
The middle band is the foundation of Bollinger Bands. It represents the average price of the asset over a specified period. A 20-day simple moving average is often used, but this period can be adjusted to suit your trading strategy. For example, short-term traders may use a shorter moving average, such as 10 days, while long-term traders may use a longer moving average, such as 50 days.
Upper and Lower Bands (Standard Deviation Bands)
The upper and lower bands are calculated by adding and subtracting a specified number of standard deviations from the middle band. Standard deviation is a measure of price volatility. The higher the standard deviation, the greater the distance between the upper and lower bands, indicating increased market volatility. Two standard deviations are usually used, but this number can also be adjusted.
Chapter 2: Basic Trading Strategies Using Bollinger Bands
There are several basic strategies that can be used with Bollinger Bands:
Squeeze Strategy
A squeeze occurs when the upper and lower bands converge, indicating a period of low volatility. This period is often followed by a period of high volatility, so it can be a signal of a potential trading opportunity. Traders can look for a breakout above the upper band or below the lower band to determine the direction of the trade.
Example: If Saudi Aramco's stock is experiencing a squeeze, it may indicate that the price is about to move significantly. Traders can monitor the stock and wait for a breakout above the upper band to enter a buy trade, or a breakout below the lower band to enter a sell trade.
Bounce Strategy
This strategy is based on the idea that the price tends to bounce off the upper and lower bands. Traders can buy when the price approaches the lower band (assuming it is oversold) and sell when the price approaches the upper band (assuming it is overbought).
Example: If the USD/SAR exchange rate is approaching the lower band, it may indicate that the US dollar is oversold and is likely to rise. Traders can buy USD/SAR.
Breakout Strategy
A breakout occurs when the price breaks above the upper band or below the lower band. A breakout above the upper band can indicate the start of a new uptrend, while a breakout below the lower band can indicate the start of a new downtrend.
Example: If the price of Bitcoin breaks above the upper Bollinger Band, it may indicate the start of a new uptrend. Traders can buy Bitcoin.
Chapter 3: Advanced Trading Strategies Using Bollinger Bands
In addition to the basic strategies, there are several advanced strategies that can be used with Bollinger Bands:
Using Bollinger Bands with Other Indicators
Bollinger Bands can be combined with other indicators, such as the Relative Strength Index (RSI) or the Moving Average Convergence Divergence (MACD), to obtain more accurate trading signals. For example, the RSI can be used to confirm the overbought and oversold signals provided by Bollinger Bands.
Adjusting Bollinger Bands Settings
Bollinger Bands settings, such as the moving average period and the number of standard deviations, can be adjusted to suit different market conditions. For example, in volatile markets, it may be necessary to use a larger number of standard deviations to ensure that the upper and lower bands cover a wider range of prices.
Chapter 4: Risk Management When Trading with Bollinger Bands
Risk management is crucial when trading with any strategy, including Bollinger Bands strategies. It is important to set stop-loss and take-profit levels before entering any trade.
Example: If you are trading using the bounce strategy and buying when the price approaches the lower band, you can place a stop-loss just below the lower band and take-profit near the middle band.
Chapter 5: Practical Examples from the Arab Market
Let's look at some practical examples of how Bollinger Bands can be used in the Arab market:
SABIC Stock: Bollinger Bands can be used to identify potential buying and selling opportunities in SABIC stock. For example, if the price is approaching the lower band, it may indicate a potential buying opportunity.
Oil Market: Bollinger Bands can be used to analyze oil prices and identify potential trading opportunities. For example, if oil prices are in a squeeze, it may indicate that prices are about to move significantly.
Chapter 6: Common Mistakes When Using Bollinger Bands
There are some common mistakes traders make when using Bollinger Bands:
- Relying on Bollinger Bands alone: It is important to use Bollinger Bands with other indicators to confirm trading signals.
- Not adjusting settings: It is important to adjust Bollinger Bands settings to suit different market conditions.
- Not managing risk: It is important to set stop-loss and take-profit levels before entering any trade.
Chapter 7: Tips for Improving Trading Strategies Using Bollinger Bands
Here are some tips for improving trading strategies using Bollinger Bands:
- Practice using Bollinger Bands in a demo account before trading with real money.
- Stay up to date with market news and economic events that may affect prices.
- Be patient and wait for the right opportunities to enter trades.
Chapter 8: Additional Tools and Resources
There are many tools and resources available to help you learn more about Bollinger Bands:
- Educational Websites: Investopedia, BabyPips
- Books: Bollinger on Bollinger Bands by John Bollinger
- Analytical Software: MetaTrader 4, TradingView
Chapter 9: The Future of Bollinger Bands in the Trading World
Despite the emergence of many new technical indicators, Bollinger Bands remain a powerful and popular tool among traders. They are likely to continue to be used in the future, especially with the development of technology and increased access to financial data.
Chapter 10: Conclusion
Bollinger Bands are a valuable tool for analyzing financial markets and identifying potential trading opportunities. By understanding its basic components and applying different trading strategies, you can increase your chances of success in trading. However, it is important to remember that risk management is crucial and should be an essential part of your strategy.
Disclaimer: Trading in financial markets involves high risks and may not be suitable for all investors. You should consult a financial advisor before making any investment decisions.


