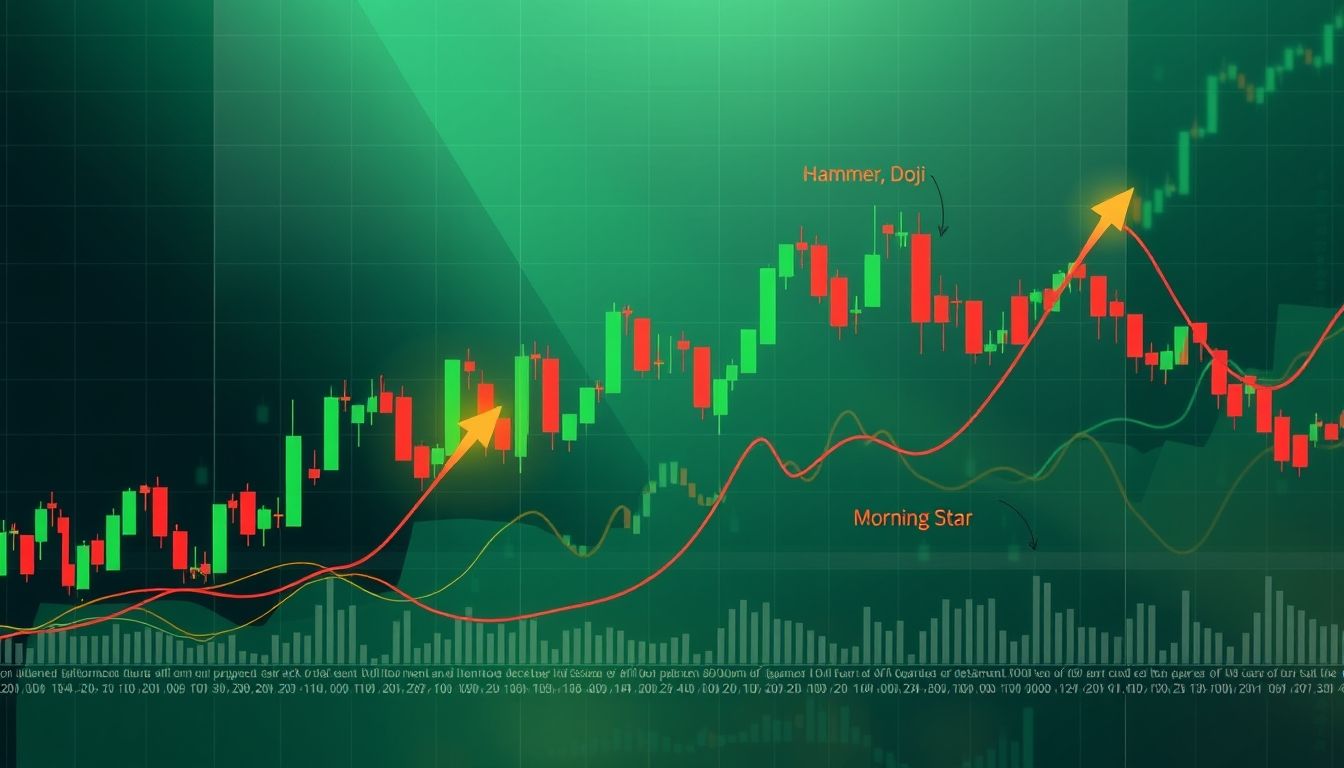
Introduction to Japanese Candlesticks
Japanese candlesticks are a powerful technical analysis tool used to identify potential price trends in financial markets. Candlesticks provide a visual representation of price movement over a specific time period, helping traders make informed decisions.
What are Japanese Candlesticks?
A candlestick consists of two main parts: the body and the shadows (or wicks). The body represents the range between the opening and closing price, while the shadows represent the highest and lowest price reached during the time period.
Parts of a Japanese Candlestick:
- Body: Represents the difference between the opening and closing price. If the closing price is higher than the opening price, the body is usually green or white (bullish candlestick). If the closing price is lower than the opening price, the body is usually red or black (bearish candlestick).
- Shadows (Wicks): Represent the range between the highest and lowest price during the time period. The upper shadow represents the highest price, and the lower shadow represents the lowest price.
Basic Candlestick Patterns
There are many basic candlestick patterns that can indicate potential reversals in the trend or continuation of the current trend. Understanding these patterns can help traders improve their trading strategies.
1. Doji Candlestick
The Doji candlestick is characterized by the opening and closing prices being equal or very close to each other. A Doji indicates a state of uncertainty in the market, where there is no clear control by buyers or sellers.
Types of Doji Candlesticks:
- Star Doji: Very small body with long shadows.
- Gravestone Doji: Long upper shadow and very small body near the lowest price.
- Dragonfly Doji: Long lower shadow and very small body near the highest price.
2. Hammer Candlestick
The Hammer candlestick is characterized by a small body and a long lower shadow. It usually appears at the end of a downtrend and indicates a potential reversal in the trend.
3. Hanging Man Candlestick
The Hanging Man candlestick is similar to the Hammer candlestick, but it appears at the end of an uptrend. It indicates a potential reversal to a downtrend.
4. Bullish Engulfing Candlestick
Consists of a small bearish candlestick followed by a large bullish candlestick that "engulfs" the bearish candlestick. It indicates a potential reversal to an uptrend.
5. Bearish Engulfing Candlestick
Consists of a small bullish candlestick followed by a large bearish candlestick that "engulfs" the bullish candlestick. It indicates a potential reversal to a downtrend.
Advanced Candlestick Patterns
In addition to the basic patterns, there are many advanced patterns that can provide more accurate signals about potential price movement.
1. Morning Star
Consists of three candlesticks: a large bearish candlestick, a small candlestick (Doji or small body) that gaps down, and a large bullish candlestick. It indicates a potential reversal to an uptrend.
2. Evening Star
Consists of three candlesticks: a large bullish candlestick, a small candlestick (Doji or small body) that gaps up, and a large bearish candlestick. It indicates a potential reversal to a downtrend.
3. Three White Soldiers
Consists of three consecutive bullish candlesticks, each of which opens within the body of the previous candlestick and closes higher than the previous candlestick's close. It indicates a continuation of the uptrend.
4. Three Black Crows
Consists of three consecutive bearish candlesticks, each of which opens within the body of the previous candlestick and closes lower than the previous candlestick's close. It indicates a continuation of the downtrend.
Combining Candlesticks with Other Technical Analysis Tools
To improve the accuracy of candlestick signals, it is recommended to combine them with other technical analysis tools, such as trendlines, moving averages, and technical indicators.
1. Trendlines
Trendlines can be used to confirm the market trend and identify potential support and resistance levels. Combining trendlines with candlestick patterns can help identify potential entry and exit points.
2. Moving Averages
Moving averages can be used to identify the overall trend of the market and smooth out price movement. Combining moving averages with candlestick patterns can help confirm potential reversal signals.
3. Technical Indicators
Technical indicators, such as the Relative Strength Index (RSI) and the Moving Average Convergence Divergence (MACD), can be used to identify overbought or oversold conditions in the market. Combining technical indicators with candlestick patterns can help improve the accuracy of trading signals.
Trading Strategies Using Candlesticks
There are many trading strategies that can be used with candlestick patterns. Here are some examples:
1. Hammer Strategy
When a Hammer candlestick appears at the end of a downtrend, traders can enter a buy trade after confirming the reversal with a subsequent bullish candlestick.
2. Bullish Engulfing Strategy
When a Bullish Engulfing pattern appears, traders can enter a buy trade after confirming the reversal with a subsequent bullish candlestick.
3. Morning Star Strategy
When a Morning Star pattern appears, traders can enter a buy trade after confirming the reversal with a subsequent bullish candlestick.
Risk Management in Candlestick Trading
Risk management is an essential part of any trading strategy. Traders should always use stop-loss orders to protect their capital and determine the size of positions based on their risk tolerance.
1. Stop-Loss Orders
Stop-loss orders should be placed at a level below the lowest price in the Hammer candlestick or the Bullish Engulfing or Morning Star pattern. This helps limit potential losses if the expected reversal does not occur.
2. Position Sizing
Position sizes should be determined based on risk tolerance. Traders should not risk more than 1-2% of their capital on any single trade.
Real-World Examples from the Arab Market
Let's take an example of Saudi Aramco's stock. In March 2023, a Hammer pattern appeared on the daily chart of the stock, indicating a potential reversal to an uptrend. After confirming the reversal with a subsequent bullish candlestick, traders could have entered a buy trade and made good profits.
Real-World Examples from the Global Market
Let's take an example of Apple's stock. In June 2023, a Morning Star pattern appeared on the daily chart of the stock, indicating a potential reversal to an uptrend. After confirming the reversal with a subsequent bullish candlestick, traders could have entered a buy trade and made good profits.
Practical Tips for Traders
- Practice identifying candlestick patterns on historical charts.
- Use a demo account to practice trading using candlestick patterns before risking real capital.
- Be patient and disciplined and do not trade based on emotions.
- Continue to learn and develop your technical analysis skills.
Conclusion
Japanese candlesticks are a powerful technical analysis tool that can help traders make informed trading decisions. By understanding the different patterns of Japanese candlesticks and combining them with other technical analysis tools, traders can improve their trading strategies and increase their chances of making profits.


