مقدمة إلى عالم التحليل الفني للعملات الرقمية
يشهد سوق العملات الرقمية تقلبات كبيرة، مما يجعل التحليل الفني أداة أساسية للمستثمرين والمتداولين. التحليل الفني هو دراسة الرسوم البيانية التاريخية للأسعار لتوقع تحركات الأسعار المستقبلية. يعتمد على فكرة أن التاريخ يعيد نفسه وأن أنماط الأسعار السابقة يمكن أن تشير إلى الاتجاهات المستقبلية. في هذا الدليل الشامل، سنستكشف كيفية قراءة مخططات العملات الرقمية، وفهم المؤشرات الفنية الرئيسية، وتطبيق استراتيجيات التداول الفعالة.
الفصل الأول: أساسيات قراءة مخططات العملات الرقمية
أنواع المخططات
هناك ثلاثة أنواع رئيسية من المخططات المستخدمة في التحليل الفني:
- مخططات الخطوط: تعرض سعر الإغلاق لفترة زمنية محددة. بسيطة وسهلة الفهم، ولكنها لا توفر الكثير من التفاصيل.
- مخططات الأعمدة: تعرض سعر الافتتاح، والإغلاق، وأعلى سعر، وأقل سعر لفترة زمنية محددة. توفر معلومات أكثر من مخططات الخطوط.
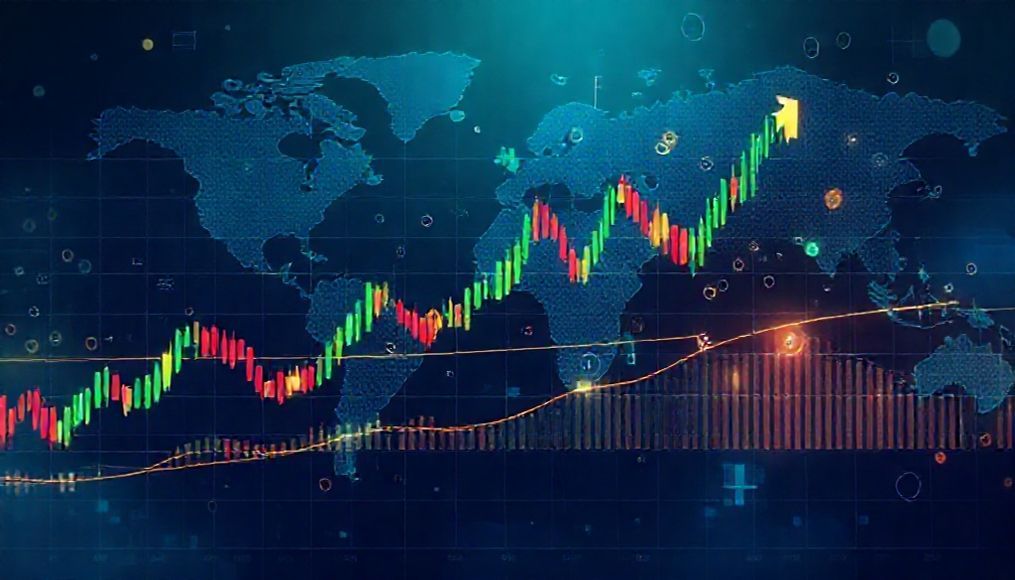
- مخططات الشموع اليابانية: تشبه مخططات الأعمدة، ولكنها تستخدم ألوانًا مختلفة للإشارة إلى ما إذا كان سعر الإغلاق أعلى أو أقل من سعر الافتتاح. تعتبر الأكثر شعبية بين المتداولين.
مثال: لنفترض أننا ننظر إلى مخطط الشموع اليابانية لعملة البيتكوين. إذا كانت الشمعة خضراء، فهذا يعني أن سعر الإغلاق كان أعلى من سعر الافتتاح. وإذا كانت الشمعة حمراء، فهذا يعني أن سعر الإغلاق كان أقل من سعر الافتتاح.
الفترات الزمنية
يمكن عرض المخططات بفترات زمنية مختلفة، مثل دقيقة واحدة، أو 5 دقائق، أو ساعة واحدة، أو يوم واحد، أو أسبوع واحد، أو شهر واحد. يعتمد اختيار الفترة الزمنية المناسبة على أسلوب التداول الخاص بك. المتداولون اليوميون يفضلون الفترات الزمنية القصيرة، بينما يفضل المستثمرون الفترات الزمنية الطويلة.
الفصل الثاني: فهم الاتجاهات وأنماط الرسوم البيانية
الاتجاهات
الاتجاه هو اتجاه حركة السعر على مدى فترة زمنية محددة. هناك ثلاثة أنواع رئيسية من الاتجاهات:
- الاتجاه الصاعد: سلسلة من الارتفاعات والانخفاضات المتزايدة.
- الاتجاه الهابط: سلسلة من الارتفاعات والانخفاضات المتناقصة.
- الاتجاه الجانبي: يتحرك السعر ضمن نطاق ضيق، دون اتجاه واضح.
مثال: إذا كان سعر عملة الإيثيريوم يرتفع باستمرار على مدى الأشهر الثلاثة الماضية، فهذا يشير إلى اتجاه صاعد.
أنماط الرسوم البيانية
أنماط الرسوم البيانية هي أشكال تتشكل على المخطط ويمكن أن تشير إلى تحركات الأسعار المستقبلية. بعض الأنماط الشائعة تشمل:
- الرأس والكتفين: يشير إلى انعكاس محتمل للاتجاه الصاعد.
- القاع المزدوج: يشير إلى انعكاس محتمل للاتجاه الهابط.
- المثلثات: تشير إلى استمرار أو انعكاس محتمل للاتجاه، حسب نوع المثلث (صاعد، هابط، متماثل).
مثال: إذا ظهر نمط الرأس والكتفين على مخطط البيتكوين، فقد يشير ذلك إلى أن الاتجاه الصاعد الحالي يقترب من نهايته وقد يبدأ السعر في الانخفاض.
الفصل الثالث: المؤشرات الفنية الأساسية
المتوسطات المتحركة (Moving Averages)
المتوسطات المتحركة هي مؤشرات تتبع الاتجاه تحسب متوسط سعر الأصل على مدى فترة زمنية محددة. تستخدم لتحديد الاتجاهات وتنعيم تقلبات الأسعار.
أنواع المتوسطات المتحركة:
- المتوسط المتحرك البسيط (SMA): يحسب متوسط السعر على مدى فترة زمنية محددة.
- المتوسط المتحرك الأسي (EMA): يعطي وزنًا أكبر للأسعار الأحدث، مما يجعله أكثر استجابة للتغيرات في الأسعار.
مثال: يمكن استخدام المتوسط المتحرك لمدة 50 يومًا لتحديد الاتجاه العام لسعر عملة الريبل. إذا كان السعر أعلى من المتوسط المتحرك، فهذا يشير إلى اتجاه صاعد. وإذا كان السعر أقل من المتوسط المتحرك، فهذا يشير إلى اتجاه هابط.
مؤشر القوة النسبية (RSI)
مؤشر القوة النسبية (RSI) هو مذبذب يقيس قوة حركة السعر ويحدد ما إذا كان الأصل في منطقة ذروة الشراء أو ذروة البيع. يتراوح بين 0 و 100. تعتبر القراءة فوق 70 منطقة ذروة الشراء، بينما تعتبر القراءة أقل من 30 منطقة ذروة البيع.
مثال: إذا كان مؤشر القوة النسبية لعملة الكاردانو فوق 70، فقد يشير ذلك إلى أن السعر مبالغ فيه وقد يكون هناك تصحيح قادم.
مؤشر الماكد (MACD)
مؤشر الماكد (MACD) هو مؤشر زخم يظهر العلاقة بين متوسطين متحركين أسيين. يستخدم لتحديد الاتجاهات وتحديد نقاط الدخول والخروج المحتملة.
مثال: إذا عبر خط الماكد فوق خط الإشارة، فقد يشير ذلك إلى إشارة شراء. وإذا عبر خط الماكد تحت خط الإشارة، فقد يشير ذلك إلى إشارة بيع.
الفصل الرابع: مستويات الدعم والمقاومة
مستويات الدعم والمقاومة هي مستويات الأسعار التي يميل السعر إلى التوقف عندها أو الانعكاس منها. مستوى الدعم هو مستوى السعر الذي يميل السعر إلى الارتداد منه، بينما مستوى المقاومة هو مستوى السعر الذي يميل السعر إلى الانخفاض منه.
مثال: إذا كان سعر عملة الدوجكوين يرتد باستمرار من مستوى 0.05 دولار، فهذا يشير إلى أن 0.05 دولار هو مستوى دعم قوي. وإذا كان السعر ينخفض باستمرار من مستوى 0.10 دولار، فهذا يشير إلى أن 0.10 دولار هو مستوى مقاومة قوي.
الفصل الخامس: حجم التداول
حجم التداول هو عدد الأسهم أو العقود التي يتم تداولها خلال فترة زمنية محددة. يمكن أن يوفر حجم التداول معلومات قيمة حول قوة الاتجاه. يشير الحجم الكبير خلال الاتجاه الصاعد إلى قوة الاتجاه، بينما يشير الحجم الكبير خلال الاتجاه الهابط إلى قوة الاتجاه الهابط.
مثال: إذا كان سعر عملة سولانا يرتفع مع حجم تداول كبير، فهذا يشير إلى أن هناك اهتمامًا قويًا بالشراء وأن الاتجاه الصاعد من المرجح أن يستمر.
الفصل السادس: استراتيجيات التداول الشائعة
تداول الاختراق (Breakout Trading)
تداول الاختراق هو استراتيجية تتضمن شراء الأصل عندما يخترق مستوى مقاومة أو بيعه عندما يخترق مستوى دعم. يعتمد على فكرة أن السعر سيستمر في التحرك في اتجاه الاختراق.
تداول الارتداد (Bounce Trading)
تداول الارتداد هو استراتيجية تتضمن شراء الأصل عندما يرتد من مستوى دعم أو بيعه عندما يرتد من مستوى مقاومة. يعتمد على فكرة أن السعر سيعود إلى النطاق السابق.
تداول الاتجاه (Trend Following)
تداول الاتجاه هو استراتيجية تتضمن شراء الأصل عندما يكون في اتجاه صاعد وبيعه عندما يكون في اتجاه هابط. يعتمد على فكرة أن الاتجاهات تميل إلى الاستمرار.
الفصل السابع: إدارة المخاطر
إدارة المخاطر هي جانب حاسم في التداول. من المهم تحديد مقدار المخاطرة التي أنت على استعداد لتحملها قبل الدخول في أي صفقة. بعض استراتيجيات إدارة المخاطر الشائعة تشمل:
- أوامر وقف الخسارة (Stop-Loss Orders): تحدد الحد الأقصى للخسارة التي أنت على استعداد لتحملها في الصفقة.
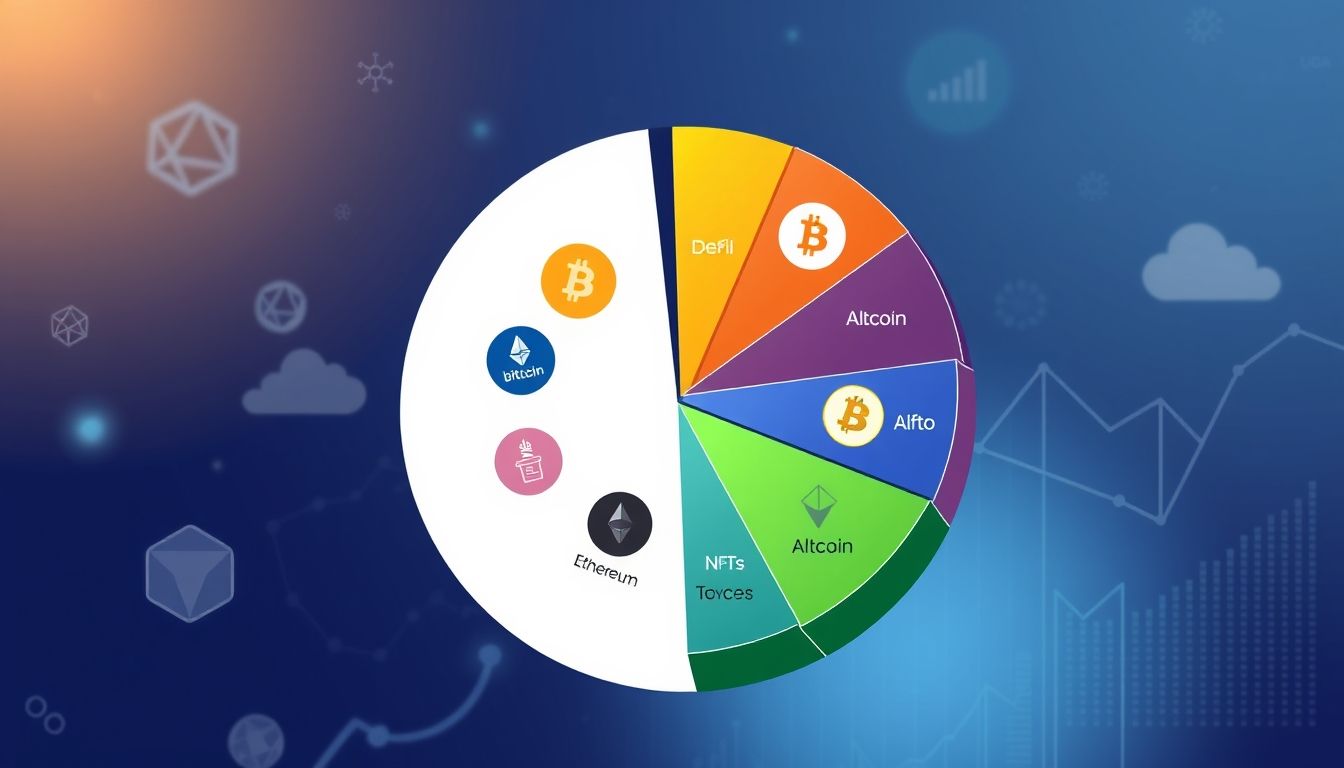
- تنويع المحفظة: توزيع استثماراتك على مجموعة متنوعة من الأصول لتقليل المخاطر.
- حجم المركز: تحديد حجم المركز بناءً على حجم حسابك ومقدار المخاطرة التي أنت على استعداد لتحملها.
الفصل الثامن: أدوات وموارد التحليل الفني
هناك العديد من الأدوات والموارد المتاحة لمساعدة المتداولين في التحليل الفني. بعض الأدوات والموارد الشائعة تشمل:
- منصات التداول: توفر الرسوم البيانية والمؤشرات الفنية وأدوات التداول. أمثلة: TradingView, MetaTrader 4.
- مواقع الأخبار المالية: توفر الأخبار والتحليلات حول الأسواق المالية. أمثلة: Investing.com, Bloomberg.
- الكتب والدورات التدريبية: توفر معلومات حول التحليل الفني واستراتيجيات التداول.
الفصل التاسع: أخطاء شائعة يجب تجنبها
هناك العديد من الأخطاء الشائعة التي يرتكبها المتداولون الجدد. بعض الأخطاء الشائعة تشمل:
- التداول العاطفي: اتخاذ القرارات بناءً على الخوف أو الجشع.
- المبالغة في التداول: التداول بشكل متكرر جدًا.
- عدم وجود خطة تداول: الدخول في الصفقات دون خطة واضحة.
- تجاهل إدارة المخاطر: عدم استخدام أوامر وقف الخسارة أو تنويع المحفظة.
الفصل العاشر: نصائح للمتداولين المبتدئين
إليك بعض النصائح للمتداولين المبتدئين:
- ابدأ صغيرًا: ابدأ بتداول كميات صغيرة من المال حتى تكتسب الخبرة.
- تعلم باستمرار: استمر في تعلم المزيد عن التحليل الفني واستراتيجيات التداول.
- كن صبورًا: يستغرق الأمر وقتًا لتصبح متداولًا ناجحًا.
- احتفظ بسجل تداول: سجل جميع صفقاتك لتتبع أدائك وتحديد نقاط القوة والضعف لديك.
إخلاء المسؤولية: هذا المقال هو لأغراض تعليمية فقط ولا ينبغي اعتباره نصيحة مالية. التداول في العملات الرقمية ينطوي على مخاطر عالية وقد لا يكون مناسبًا لجميع المستثمرين. استشر مستشارًا ماليًا قبل اتخاذ أي قرارات استثمارية.