Introduction to Technical Analysis of Cryptocurrencies
In the volatile world of cryptocurrencies, technical analysis is an essential tool for traders seeking to make informed decisions. Technical analysis relies on studying historical price charts and trading volume to identify patterns and potential future trends. This article aims to provide you with a comprehensive understanding of technical analysis and how to apply it to cryptocurrency trading.
Chapter 1: Fundamentals of Technical Analysis
What is Technical Analysis?
Technical analysis is a methodology for evaluating and analyzing investments by studying statistics generated by market activity, such as prices and trading volume. Unlike fundamental analysis, which focuses on economic and financial factors, technical analysis focuses on identifying patterns and trends in price charts.
Basic Principles of Technical Analysis
- Price Discounts Everything: Technical analysis assumes that all relevant market information is already reflected in the asset's price.
- Prices Move in Trends: Technical analysts believe that prices tend to move in specific directions (upward, downward, or sideways).
- History Repeats Itself: Technical analysis assumes that historical price patterns tend to repeat.
Chapter 2: Types of Charts Used in Technical Analysis
Line Chart
A line chart is the simplest type of chart, connecting closing price points over a specified period. It provides a quick overview of the overall price trend.
Bar Chart
A bar chart displays the price range (high and low), opening price, and closing price for each time period. It provides more detailed information than a line chart.
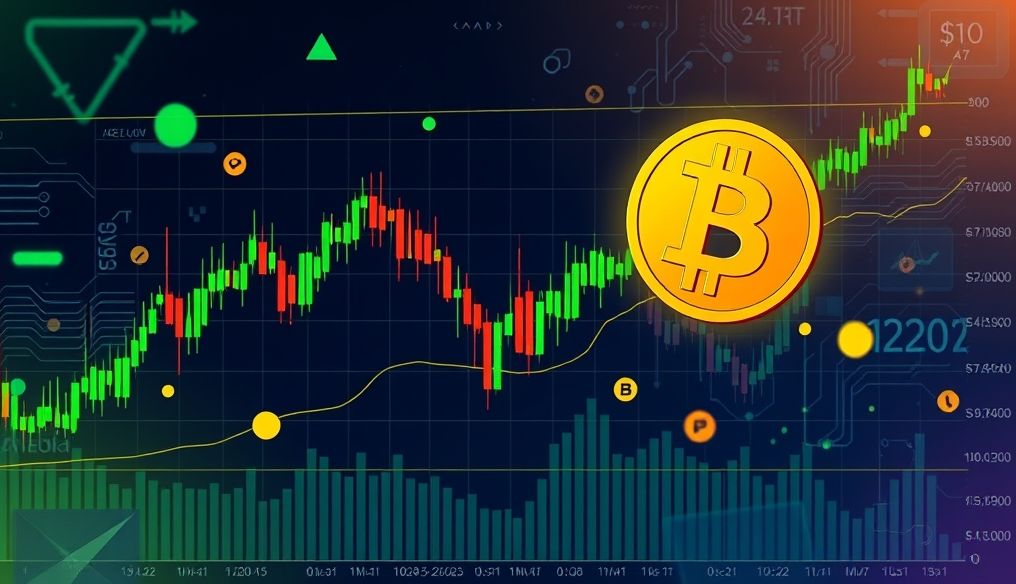
Candlestick Chart
A candlestick chart is the most commonly used in technical analysis. It displays the same information as a bar chart, but adds color to distinguish whether the closing price is higher or lower than the opening price. Bullish candles (usually green or white) indicate a price increase, while bearish candles (usually red or black) indicate a price decrease.
Chapter 3: Common Technical Indicators
Moving Averages (MA)
Moving averages are trend-following indicators that calculate the average price of an asset over a specified period. They help smooth out price movements and reduce noise.
Types of Moving Averages:
- Simple Moving Average (SMA): Calculates the average by summing the prices over a specified period and dividing by the number of periods.
- Exponential Moving Average (EMA): Gives more weight to recent prices, making it more sensitive to recent price changes.
Relative Strength Index (RSI)
The Relative Strength Index (RSI) is an oscillator that measures the speed and change of price movements. It ranges from 0 to 100. Readings above 70 are considered overbought, while readings below 30 are considered oversold.
Moving Average Convergence Divergence (MACD)
The Moving Average Convergence Divergence (MACD) is a trend-following momentum indicator that measures the relationship between two moving averages. It consists of the MACD line, the signal line, and the histogram. It is used to identify momentum changes and generate buy and sell signals.
Chapter 4: Chart Patterns
Continuation Patterns
Continuation patterns indicate that the current trend is likely to continue. Examples of continuation patterns include flags and triangles.
Reversal Patterns
Reversal patterns indicate that the current trend may reverse. Examples of reversal patterns include head and shoulders, and double tops and bottoms.
Examples of Chart Patterns
Head and Shoulders: A reversal pattern indicating a shift from an uptrend to a downtrend.
Double Bottom: A reversal pattern indicating a shift from a downtrend to an uptrend.
Ascending Triangle: A continuation pattern indicating that the uptrend is likely to continue.
Chapter 5: Trend Lines, Support, and Resistance
Trend Lines
Trend lines are straight lines that connect a series of highs or lows to identify the price trend. They can be used to identify dynamic support and resistance levels.
Support and Resistance Levels
Support levels are price levels at which the price tends to bounce, while resistance levels are price levels at which the price tends to fall. These levels can be used to identify potential entry and exit points.
Chapter 6: Trading Volume and Its Significance
Trading volume is the number of shares or contracts traded during a specified period. Trading volume can provide valuable information about the strength of a trend. A strong trend is usually supported by high trading volume, while a weak trend may be supported by low trading volume.
Chapter 7: Trading Strategies Based on Technical Analysis
Trend Following Strategy
A trend-following strategy involves identifying the prevailing trend and entering trades that align with that trend. Moving averages and trend lines can be used to identify the trend.
Swing Trading Strategy
A swing trading strategy involves holding trades for several days or weeks to profit from price fluctuations. Indicators such as RSI and MACD can be used to identify swing trading opportunities.
Day Trading Strategy
A day trading strategy involves opening and closing trades on the same day to profit from small price movements. This strategy requires constant monitoring of the markets and quick trading skills.
Chapter 8: Risk Management in Cryptocurrency Trading
Position Sizing
Determining the appropriate position size is crucial for risk management. You should not risk more than a small percentage of your trading capital on any single trade (typically between 1% and 2%).
Setting Stop-Loss Orders
Stop-loss orders are orders to automatically close a trade if the price reaches a certain level. They help limit potential losses.
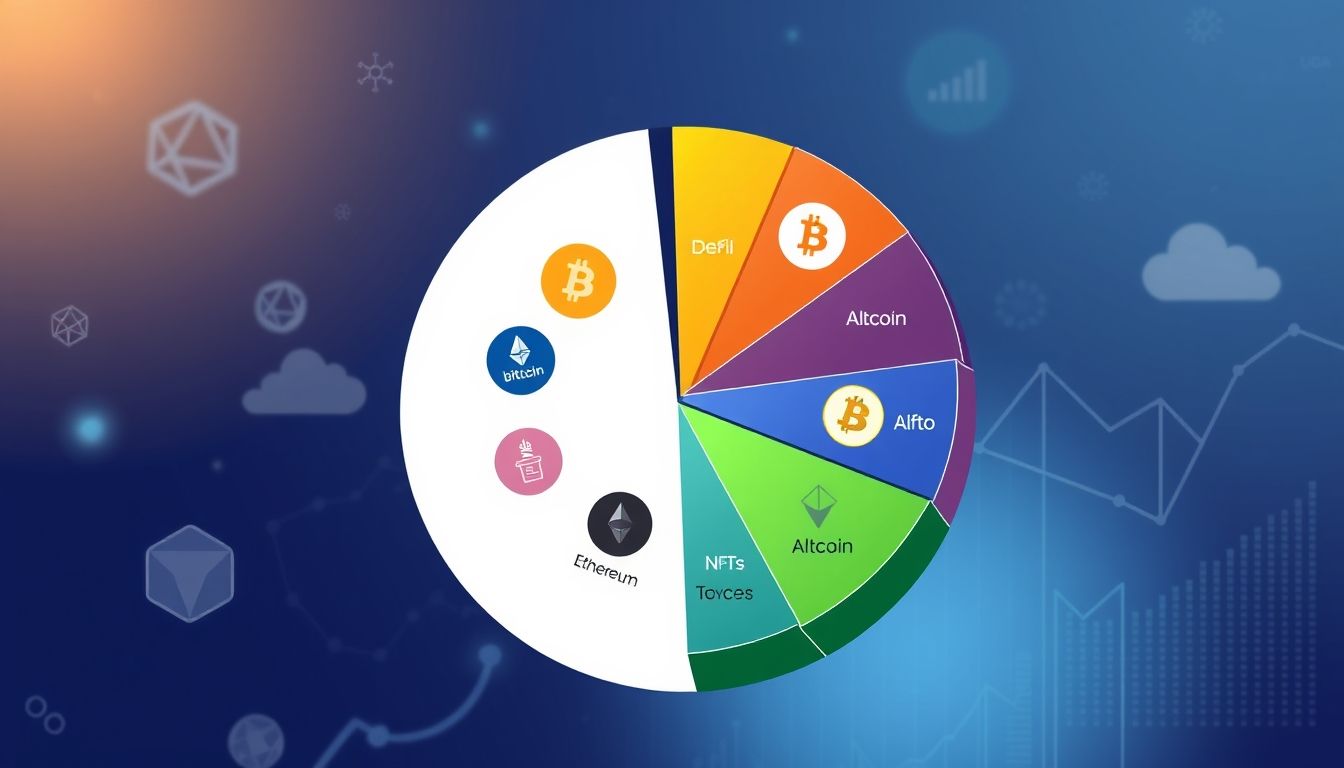
Portfolio Diversification
Diversifying your portfolio by investing in a variety of cryptocurrencies can help reduce overall risk.
Chapter 9: Technical Analysis Tools and Platforms
TradingView
TradingView is a popular technical analysis platform that provides a wide range of tools and features, including advanced charts, technical indicators, and drawing tools.
MetaTrader 4/5
MetaTrader 4 and MetaTrader 5 are popular trading platforms that support a wide range of technical indicators and drawing tools. They can be used to trade cryptocurrencies through specialized brokers.
Chapter 10: Tips for Beginner Traders
- Start with a Demo Account: Practice trading using a demo account before risking real money.
- Learn Continuously: Continue to learn more about technical analysis and trading strategies.
- Be Patient and Disciplined: Don't rush into making decisions and be disciplined in following your trading plan.
- Record Your Trades: Keep a record of all your trades to analyze your performance and identify areas for improvement.