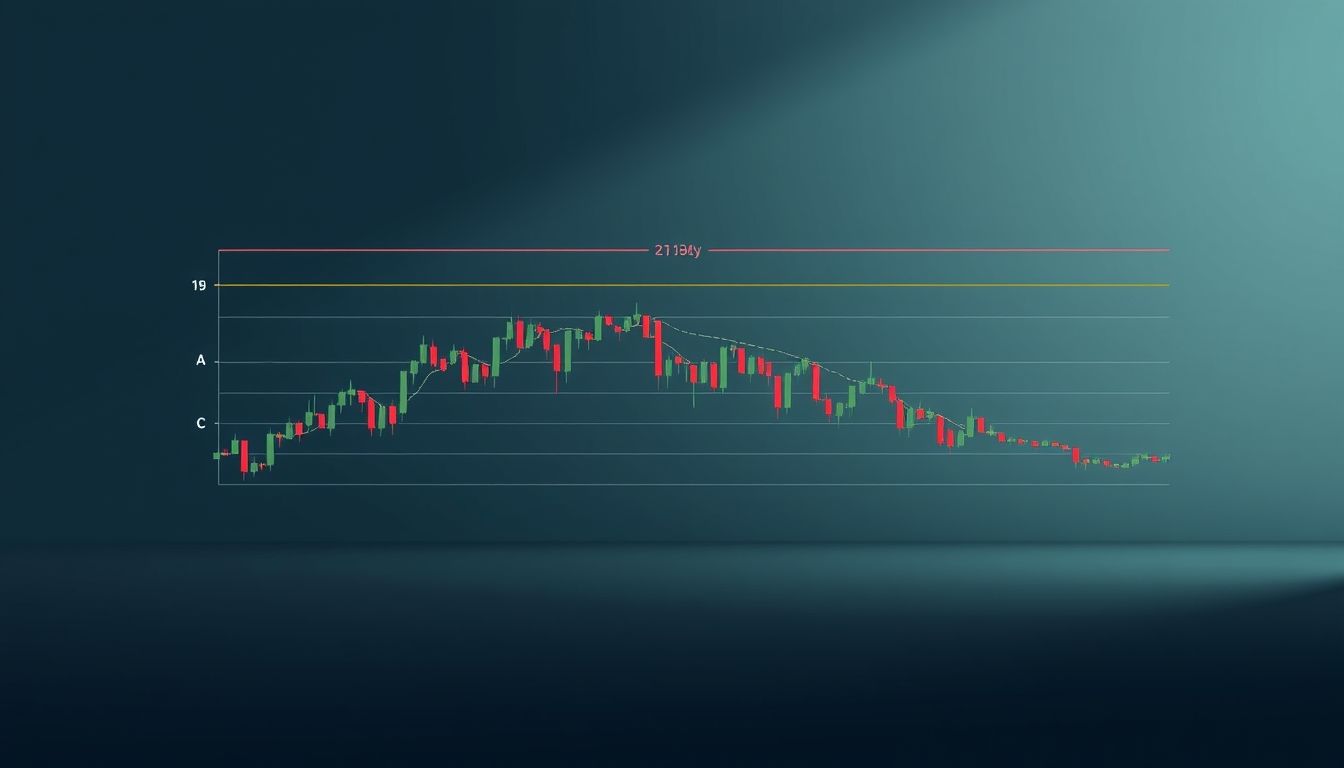
Introduction to Elliott Wave Theory
Elliott Wave Theory is a form of technical analysis used to forecast financial market trends by identifying recurring wave patterns. Developed by Ralph Nelson Elliott in the 1930s, it's based on the idea that stock prices move in specific patterns called "waves."
The theory is based on the observation that investor behavior repeats in psychological cycles, leading to the formation of predictable price patterns. These patterns consist of impulse waves and corrective waves.
Chapter 1: Basics of Elliott Wave Theory
1.1 What are Elliott Waves?
A complete Elliott cycle consists of eight waves. Five impulse waves (1, 2, 3, 4, 5) move in the direction of the main trend, and three corrective waves (A, B, C) move against the main trend.
- Impulse Waves: Move in the direction of the prevailing trend and consist of five sub-waves.
- Corrective Waves: Move against the prevailing trend and consist of three sub-waves.
Example: In a bullish market, waves 1, 3, and 5 represent upward movements, while waves 2 and 4 represent minor pullbacks before the resumption of the uptrend.
1.2 Elliott Wave Rules
There are three basic rules that must be followed when applying Elliott Wave Theory:
- Wave 2 cannot retrace beyond the beginning of wave 1.
- Wave 4 cannot overlap the price territory of wave 1.
- Wave 3 must be the longest among the impulse waves (1, 3, 5).
Important: Breaking any of these rules indicates that the analysis may be incorrect and should be re-evaluated.
Chapter 2: Impulse Waves
2.1 Characteristics of Impulse Waves
Impulse waves are characterized by their strong movement in the direction of the prevailing trend. Wave 3 is often the longest and most powerful.
Example: In the Saudi stock market, if the general index is in an uptrend, the impulse waves will be the periods when the index experiences significant increases.
2.2 Types of Impulse Waves
There are two main types of impulse waves:
- Normal Impulse Waves: Follow the three basic rules.
- Extended Impulse Waves: One of the impulse waves (usually wave 3) is much longer than the other two.
Chapter 3: Corrective Waves
3.1 Characteristics of Corrective Waves
Corrective waves move against the prevailing trend and are more complex than impulse waves. These waves are often minor corrections or consolidations before the resumption of the main trend.
3.2 Types of Corrective Waves
There are several types of corrective waves, including:
- Zigzag Corrections: Consist of three waves (A, B, C) and are relatively sharp.
- Flat Corrections: Consist of three waves (A, B, C) and are relatively horizontal.
- Triangle Corrections: Consist of five waves and converge.
Chapter 4: Fibonacci Ratios and Elliott Waves
Fibonacci ratios are commonly used to identify potential support and resistance levels in Elliott Waves. These ratios can be used to predict how deep the corrections (waves 2 and 4) may be or how far the impulse waves (wave 3) may extend.
Example: Wave 2 often retraces 38.2% or 50% of wave 1, while wave 3 may extend 161.8% of wave 1.
Chapter 5: Applying Elliott Waves in Trading
5.1 Identifying Waves
The first step is to identify the waves on the chart. Start by identifying the main trend and then look for wave patterns that fit Elliott Wave Theory.
5.2 Confirming Signals
Use other technical indicators, such as moving averages and the Relative Strength Index (RSI), to confirm the signals you get from Elliott Wave analysis.
5.3 Risk Management
Place stop-loss orders to protect your capital. Determine entry and exit points based on Elliott Wave analysis and Fibonacci ratios.
Tip: Don't put all your money into one trade. Diversify your portfolio to reduce risk.
Chapter 6: Practical Examples from the Market
6.1 Analyzing Aramco Stock
Let's analyze the movement of Aramco stock using Elliott Waves. (Here, a hypothetical analysis of the stock's movement and application of the theory is provided). Assuming the stock has gone through a complete bullish cycle, we can identify the impulse and corrective waves and predict the future movement of the stock.
6.2 Analyzing TASI Index
Elliott Wave Theory can be applied to the Saudi Stock Market Index (TASI) to identify major trends and predict future movements. (Here, a hypothetical analysis of the index's movement and application of the theory is provided).
Chapter 7: Common Mistakes in Applying Elliott Waves
There are several common mistakes traders make when applying Elliott Wave Theory, including:
- Not adhering to the basic rules.
- Trying to force the theory on the market instead of allowing the market to show patterns.
- Not using other technical indicators to confirm signals.
Chapter 8: Advanced Trading Strategies
8.1 Using Sub-Waves
Each impulse or corrective wave can be divided into smaller sub-waves. This allows for more accurate analysis and identification of better trading opportunities.
8.2 Combining Elliott Waves and Candlestick Patterns
Elliott Wave analysis can be combined with Japanese candlestick patterns to obtain more powerful trading signals.
Chapter 9: Tools and Resources for Elliott Wave Analysts
There are many tools and resources available to help traders apply Elliott Wave Theory, including:
- Charting software that supports Elliott Wave analysis.
- Books and articles that explain the theory in detail.
- Websites and forums that discuss Elliott Wave analysis.
Chapter 10: Conclusion and Final Tips
Elliott Wave Theory is a powerful tool for analyzing financial markets, but it requires careful study and practice. Use it with caution and in conjunction with other technical analysis tools and proper risk management.
Final Tip: Be patient and persistent. Learn from your mistakes and continue to improve your technical analysis skills.
Disclaimer: This article is for educational purposes only and does not constitute investment advice.


