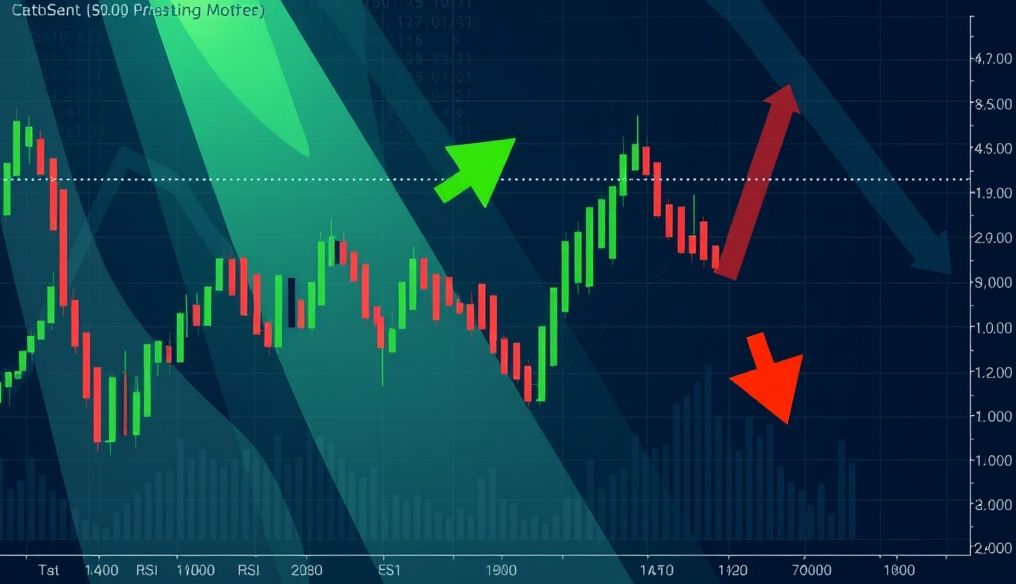
Introduction to Technical Analysis for Cryptocurrencies
The cryptocurrency market experiences significant volatility, making trading risky but also offering substantial profit opportunities. Technical analysis is an essential tool for traders seeking to understand price movements and make informed decisions. It relies on studying historical price charts and trading volume to predict future trends.
What is Technical Analysis?
Technical analysis is a methodology for evaluating investments and identifying trends by examining statistics generated by market activity, such as price and volume. Unlike fundamental analysis, which focuses on economic and financial factors, technical analysis focuses on price patterns and charts.
Importance of Technical Analysis in Cryptocurrency Trading
- Identifying optimal entry and exit points
- Reducing risk through stop-loss orders
- Understanding market trends
- Improving trading strategies
Essential Technical Analysis Tools
Candlestick Patterns
Candlestick patterns are a way to display price movements on charts. Each candlestick consists of a body and shadows. The body represents the difference between the opening and closing price, while the shadows represent the highest and lowest price during the time period.
Common Candlestick Patterns:
- Doji: Indicates indecision in the market.
- Hammer: Indicates a potential bullish reversal.
- Shooting Star: Indicates a potential bearish reversal.
Moving Averages
Moving averages are trend-following indicators that calculate the average price of an asset over a specified time period. Moving averages help smooth out price movements and identify the overall trend.
Types of Moving Averages:
- Simple Moving Average (SMA)
- Exponential Moving Average (EMA)
Example: Using a 50-day moving average to determine the long-term trend of Bitcoin.
Relative Strength Index (RSI)
The Relative Strength Index (RSI) is a momentum oscillator that measures the speed and change of price movements. The RSI ranges from 0 to 100. A reading above 70 indicates that the asset is in overbought territory, while a reading below 30 indicates that it is in oversold territory.
Moving Average Convergence Divergence (MACD)
The Moving Average Convergence Divergence (MACD) is a momentum indicator that shows the relationship between two moving averages of an asset's price. The MACD consists of the MACD line, the signal line, and the histogram.
Common Chart Patterns
Head and Shoulders
The head and shoulders pattern is a reversal pattern that indicates the end of an uptrend. The pattern consists of three peaks, with the middle peak (the head) being higher than the other two peaks (the shoulders).
Double Bottom
The double bottom pattern is a reversal pattern that indicates the end of a downtrend. The pattern consists of two consecutive bottoms at approximately the same level.
Triangles
Triangles are continuation patterns that indicate that the current trend is likely to continue. There are three main types of triangles: ascending triangles, descending triangles, and symmetrical triangles.
Cryptocurrency Trading Strategies Using Technical Analysis
Trend Following Strategy
This strategy involves identifying the prevailing trend in the market and trading in the same direction. Moving averages can be used to identify the trend.
Swing Trading Strategy
This strategy involves taking advantage of short-term price fluctuations. Momentum indicators such as RSI and MACD can be used to identify trading opportunities.
Breakout Trading Strategy
This strategy involves identifying support and resistance levels and trading when the price breaks through these levels.
Identifying Optimal Entry Points
Using Candlestick Patterns to Identify Entry Points
Candlestick patterns such as the hammer and bullish engulfing can be used to identify potential entry points in an uptrend.
Using Moving Averages to Identify Entry Points
Moving average crossovers can be used to identify entry points. For example, a 50-day moving average crossing above a 200-day moving average can be considered a buy signal.
Using Momentum Indicators to Identify Entry Points
Momentum indicators such as RSI and MACD can be used to identify entry points when the asset is in oversold territory or when a bullish crossover appears in the MACD.
Identifying Optimal Exit Points
Using Candlestick Patterns to Identify Exit Points
Candlestick patterns such as the shooting star and bearish engulfing can be used to identify potential exit points in a downtrend.
Using Moving Averages to Identify Exit Points
Moving average crossovers can be used to identify exit points. For example, a 50-day moving average crossing below a 200-day moving average can be considered a sell signal.
Using Momentum Indicators to Identify Exit Points
Momentum indicators such as RSI and MACD can be used to identify exit points when the asset is in overbought territory or when a bearish crossover appears in the MACD.
Risk Management in Cryptocurrency Trading
Setting Stop-Loss Orders
Stop-loss orders are orders to automatically sell the asset if the price reaches a certain level. Stop-loss orders help limit potential losses.
Determining Position Size
The position size should be determined based on risk tolerance and available capital. No more than 1-2% of capital should be risked on any single trade.
Diversifying the Portfolio
The portfolio should be diversified by investing in a variety of cryptocurrencies to reduce risk.
Practical Examples from the Arab and Global Markets
Example 1: Analyzing Bitcoin price movement using moving averages during 2023. Notice how the 50-day moving average crossing above the 200-day moving average was a strong buy signal.
Example 2: Using the RSI indicator to identify buying opportunities in Ethereum when the RSI was below 30.
Example 3: Analyzing the head and shoulders pattern in XRP and predicting the decrease in price.
Practical Tips for Traders
- Start with a small amount of capital and don't risk more than you can afford to lose.
- Learn the basics of technical analysis before you start trading.
- Use a demo account to practice trading strategies before trading with real money.
- Be patient and disciplined and stick to your trading strategy.
- Stay up-to-date with market news and developments in the cryptocurrency field.
Conclusion
Technical analysis is a powerful tool that can help traders make informed decisions and improve trading performance in the cryptocurrency market. By understanding the basic tools, indicators, and patterns, traders can identify optimal entry and exit points and manage risk effectively. However, it is important to remember that technical analysis is not guaranteed and there are always risks associated with trading. Traders should always do their own research and consult a financial advisor before making any investment decisions.


