Introduction to Technical Analysis of Cryptocurrencies
The cryptocurrency market experiences sharp fluctuations, making trading risky but also offering huge investment opportunities. Technical analysis is an essential tool for traders seeking to understand price movements and make informed decisions. It relies on studying historical price charts and trading volume to predict future market trends.
Chapter 1: Fundamentals of Technical Analysis
What is Technical Analysis?
Technical analysis is a methodology for evaluating investments and analyzing statistics generated by market activity, such as past prices and trading volume. It aims to identify patterns and trends that can help predict future price movements. Technical analysis differs from fundamental analysis, which focuses on the economic and financial factors that affect an asset's value.
Assumptions of Technical Analysis
- The Market Discounts Everything: This hypothesis assumes that all available information, including economic, political, and psychological factors, is already reflected in the asset's price.
- Prices Move in Trends: This hypothesis assumes that prices tend to move in specific trends (uptrend, downtrend, or sideways) for certain periods.
- History Repeats Itself: This hypothesis assumes that historical price patterns tend to repeat, allowing analysts to predict future price movements based on past performance.
Chapter 2: Types of Charts
Charts are an essential tool in technical analysis, providing a visual representation of price movements over time. There are different types of charts, each with its advantages and disadvantages. Among the most common types are:
- Line Chart: This chart connects the closing prices for a specific period. The line chart is simple and easy to understand, but it does not provide detailed information about price movements within the period.
- Bar Chart: This chart displays the opening, closing, highest, and lowest prices for a specific period. The bar chart provides more detailed information than the line chart.
- Candlestick Chart: This chart is similar to the bar chart, but it uses different colors to represent price movements. Usually, the candlestick body is green (or white) if the closing price is higher than the opening price, and red (or black) if the closing price is lower than the opening price. The candlestick chart is one of the most popular types of charts in technical analysis.
Chapter 3: Candlestick Patterns
Candlestick patterns are specific formations of candlesticks that can indicate potential reversals or continuations of a trend. There are many candlestick patterns, each with its own significance. Among the most common patterns are:
- Hammer: This candlestick appears at the end of a downtrend and indicates a potential reversal. The hammer is characterized by a small body and a long tail extending downward.
- Shooting Star: This candlestick appears at the end of an uptrend and indicates a potential reversal. The shooting star is characterized by a small body and a long tail extending upward.
- Bullish Engulfing: This pattern consists of two candlesticks, where the second candlestick engulfs the first candlestick. This pattern appears at the end of a downtrend and indicates a potential reversal.
- Bearish Engulfing: This pattern consists of two candlesticks, where the second candlestick engulfs the first candlestick. This pattern appears at the end of an uptrend and indicates a potential reversal.
Chapter 4: Trend Lines, Support, and Resistance
Trend lines and support and resistance levels are fundamental concepts in technical analysis. These tools help traders identify potential trends and areas for entering and exiting trades.
- Trend Line: A line that connects successive troughs in an uptrend or successive peaks in a downtrend. An uptrend line indicates that the price is rising, while a downtrend line indicates that the price is falling.
- Support: A price level that the price tends to bounce off. Support represents a strong demand zone where buyers are willing to buy the asset.
- Resistance: A price level that the price tends to fall from. Resistance represents a strong supply zone where sellers are willing to sell the asset.
Chapter 5: Technical Indicators
Technical indicators are mathematical calculations based on price and trading volume data. Technical indicators are used to confirm trends and identify potential entry and exit points. There are many technical indicators, each with its advantages and disadvantages. Among the most common indicators are:
- Moving Averages: Moving averages calculate the average price of an asset over a specific period. Moving averages are used to identify trends and smooth out price movements.
- Relative Strength Index (RSI): The RSI measures the strength of a trend and identifies whether the asset is in an overbought or oversold zone.
- Moving Average Convergence Divergence (MACD): The MACD measures the relationship between two moving averages. The MACD is used to identify trends and generate buy and sell signals.
- Stochastic Oscillator: The Stochastic Oscillator compares the closing price of an asset to its price range over a specific period. The Stochastic Oscillator is used to identify overbought and oversold zones.
Chapter 6: Trading Strategies Using Technical Analysis
After understanding the basics of technical analysis and technical indicators, traders can develop their own trading strategies. The appropriate strategy depends on the trading style, risk tolerance, and investment goals. Among the common strategies are:
- Trend Following: This strategy relies on identifying the prevailing trend and entering trades that align with this trend.
- Swing Trading: This strategy relies on taking advantage of short-term price fluctuations.
- Day Trading: This strategy relies on opening and closing trades on the same day.
- Breakout Trading: This strategy relies on entering trades when the price breaks through a significant support or resistance level.
Chapter 7: Risk Management
Risk management is an essential part of any successful trading strategy. Traders should determine the amount of risk they are willing to take and apply appropriate risk management techniques to protect their capital. Among the common risk management techniques are:
- Stop-Loss Orders: Stop-loss orders set the maximum loss that a trader is willing to bear in a specific trade.
- Position Sizing: Position sizing determines the amount of capital allocated to a specific trade. The position size should be proportional to risk tolerance and available capital.
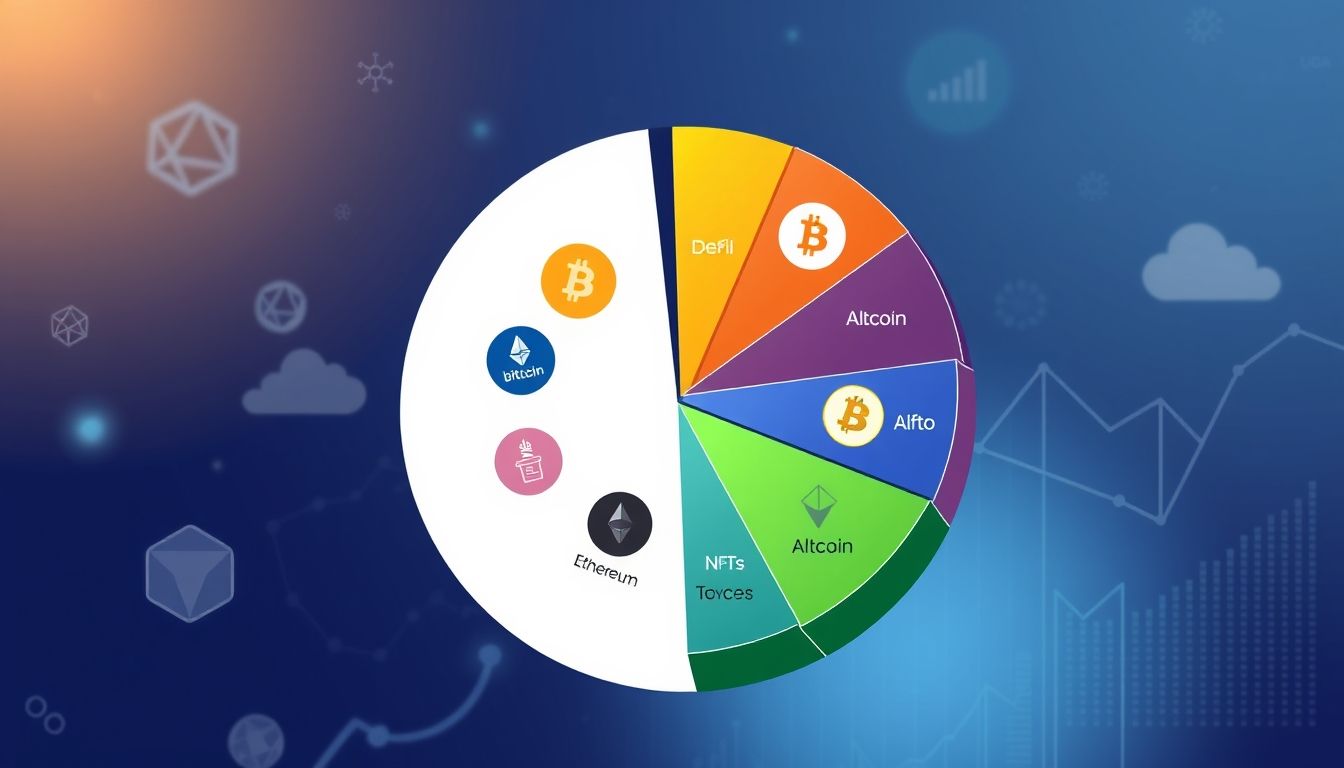
- Portfolio Diversification: Portfolio diversification reduces risk by distributing investments across a variety of assets.
Chapter 8: Available Technical Analysis Tools
Many tools and platforms are available to help traders perform technical analysis. These tools include charts, technical indicators, and drawing tools. Among the popular platforms are:
- TradingView: A comprehensive charting and technical analysis platform.
- MetaTrader 4/5: A popular trading platform that supports technical analysis and automated trading.
- CoinMarketCap: A website that provides market data for cryptocurrencies.
Chapter 9: Tips for New Traders
Here are some tips for new traders who want to learn technical analysis of cryptocurrencies:
- Start with the Basics: Learn the basics of technical analysis before moving on to advanced strategies.
- Practice on a Demo Account: Practice trading using a demo account before risking real capital.
- Be Patient: Mastering technical analysis takes time and effort.
- Learn from Your Mistakes: Review your losing trades and try to identify the reasons that led to the loss.
- Stay Informed: Follow market news and technological developments in the field of cryptocurrencies.
Chapter 10: The Future of Technical Analysis in the Cryptocurrency Market
As the cryptocurrency market continues to evolve, technical analysis will remain an essential tool for traders. However, the tools and techniques used in technical analysis may change with the emergence of new technologies such as artificial intelligence and machine learning. Artificial intelligence is likely to play an increasingly important role in analyzing data and predicting future price movements.