Introduction to Volatile Markets
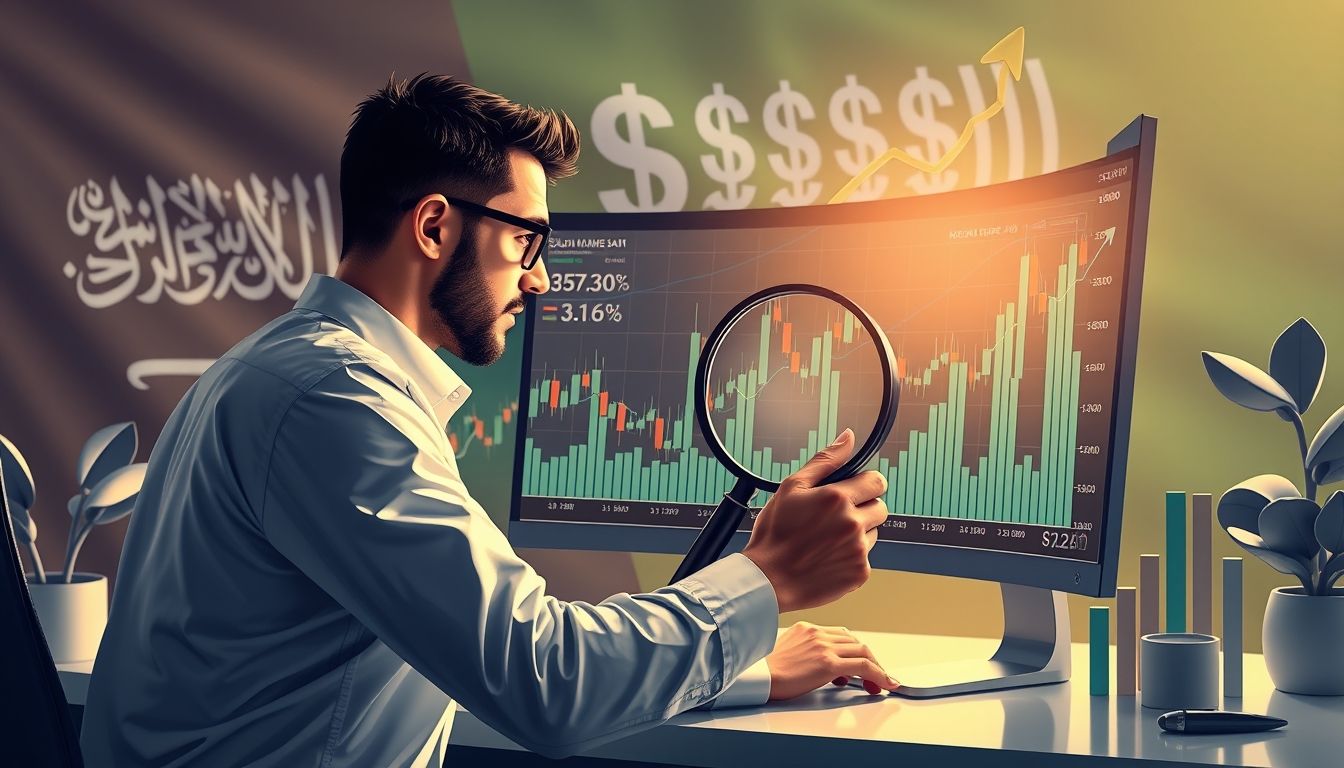
Volatile markets are those that experience sharp and unexpected price movements, both up and down. These fluctuations are often driven by economic news, geopolitical events, or even just investor sentiment. Understanding the nature of these markets is the first step towards successful trading.
Chapter 1: Understanding the Dynamics of a Volatile Market
What are Volatile Markets?
A volatile market is a financial market characterized by significant price fluctuations, both upward and downward, in a short period. These fluctuations make it difficult to predict market direction, increasing risks for traders.
Causes of Volatility in Markets
- Economic News: Such as inflation data, unemployment rates, and central bank decisions.
- Geopolitical Events: Such as wars, diplomatic crises, and political changes.
- Investor Sentiment: Fear and greed play a significant role in moving prices.
- Corporate News: Earnings reports, mergers and acquisitions, and management changes.
Measuring Volatility
There are several ways to measure volatility, including:
- Average True Range (ATR): Measures the average trading range over a specific period.
- Standard Deviation: Measures the dispersion of prices around their average.
- VIX Index: Measures market expectations of volatility for the S&P 500 index.
Chapter 2: Risk Management Strategies in Volatile Markets
Importance of Risk Management
In volatile markets, risk management becomes more critical than ever. Large fluctuations can lead to significant losses if not properly controlled.
Stop-Loss Orders
Stop-loss orders limit potential losses by automatically closing a trade when the price reaches a pre-set level. The stop-loss level should be determined based on careful technical analysis.
Example: If you buy a stock at $100, you can place a stop-loss order at $95 to protect your capital.
Diversification
Diversification means spreading investments across different assets to reduce overall risk. This can include stocks, bonds, real estate, and commodities.
Example: Instead of investing in just one sector, you can diversify your investments across different sectors such as technology, healthcare, and energy.
Position Sizing
Position sizing determines the amount you invest in a single trade. The position size should be proportional to the available capital and the acceptable level of risk.
Example: If you have $10,000, you can decide to invest only 1% or 2% of your capital in each trade.
Chapter 3: Short-Term Trading Strategies
Day Trading
Day trading is a strategy that involves opening and closing trades on the same day. This requires close monitoring of prices and quick execution of orders.
Scalping
Scalping is a strategy that involves making very small profits from minor price movements. This requires executing a large number of trades in a single day.
Swing Trading
Swing trading is a strategy that involves holding trades for several days or weeks to take advantage of price swings. This requires identifying potential entry and exit points based on technical analysis.
Chapter 4: Long-Term Trading Strategies
Value Investing
Value investing is a strategy that involves buying stocks that are trading below their intrinsic value. This requires careful fundamental analysis of companies.
Growth Investing
Growth investing is a strategy that involves buying stocks that are expected to grow their earnings rapidly. This requires identifying companies with high growth potential.
Buy and Hold Strategy
The buy and hold strategy involves buying stocks and holding them for a long period, regardless of market fluctuations. This requires selecting companies with strong fundamentals.
Chapter 5: Technical Analysis in Volatile Markets
Using Charts
Charts help identify trends, support, and resistance levels. Different types of charts can be used, such as candlestick charts, line charts, and bar charts.
Technical Indicators
Technical indicators are mathematical calculations based on price and volume data. They help identify potential trading opportunities.
Examples of Technical Indicators:
- Relative Strength Index (RSI): Measures the strength or weakness of price movement.
- Moving Averages: Calculate the average price over a specific period.
- MACD (Moving Average Convergence Divergence): Measures the relationship between two moving averages.
Chapter 6: Fundamental Analysis in Volatile Markets
Analyzing Financial Statements
Analyzing financial statements involves studying the financial statements of companies, such as the income statement, balance sheet, and cash flow statement.
Industry Analysis
Industry analysis involves studying the factors that affect a particular industry, such as competition, regulation, and innovation.
Macroeconomic Analysis
Macroeconomic analysis involves studying the factors that affect the economy as a whole, such as economic growth, inflation, and interest rates.
Chapter 7: Trading Psychology
Controlling Emotions
Fear and greed are among the strongest emotions that can affect trading decisions. You must learn how to control these emotions to avoid making rash decisions.
Avoiding Cognitive Biases
Cognitive biases are flawed thinking patterns that can lead to illogical decisions. You should be aware of these biases and try to avoid them.
Maintaining Discipline
Discipline is the key to achieving success in trading. You must adhere to the trading plan and not deviate from it due to emotions or biases.
Chapter 8: Using Leverage
What is Leverage?
Leverage is the use of borrowed funds to increase the size of an investment. Leverage can increase potential profits, but it also increases potential losses.
Risks of Leverage
Leverage significantly increases risk. It should be used with caution and only by experienced traders.
Managing Leverage
The appropriate level of leverage should be determined based on the available capital and the acceptable level of risk. Stop-loss orders should also be used to protect capital.
Chapter 9: Advanced Trading Tools
Trading Bots
Trading bots are computer programs that automatically execute trades based on pre-set rules. They can be useful in implementing complex trading strategies.
Big Data
Big data can be used to analyze large amounts of financial and economic data to identify potential trading opportunities.
Artificial Intelligence (AI)
Artificial intelligence can be used to develop predictive models for prices and make better trading decisions.
Chapter 10: Practical Examples from the Arab and Global Markets
Example from the Saudi Market
In 2022, the Saudi market experienced significant volatility due to rising oil prices and global economic news. Traders who used risk management strategies and diversified portfolios were able to achieve good profits.
Example from the US Market
In 2008, during the global financial crisis, the US market experienced a major collapse. Investors who held value stocks and stuck to the buy and hold strategy were able to recover and make profits in subsequent years.
Conclusion
Trading in volatile markets requires knowledge, skill, and discipline. By understanding market dynamics, managing risk effectively, and using appropriate strategies, you can increase your chances of success.


