Introduction to Trading with Classical Chart Patterns
Trading with classical chart patterns is a technical analysis approach based on identifying specific patterns that appear on price charts. These patterns, developed over decades of observation and analysis, indicate potential future price movements. Understanding these patterns can provide traders with a significant advantage in identifying potential entry and exit points and managing risk effectively.
Chapter 1: Fundamentals of Technical Analysis
Technical analysis is the study of historical price movements to attempt to predict future price movements. It is based on three main principles:
- Price discounts everything: The price of an asset reflects all available information, including economic, political, and psychological factors.
- Prices move in trends: Prices tend to move in specific directions (upward, downward, or sideways) for certain periods of time.
- History repeats itself: Price patterns often repeat themselves over time.
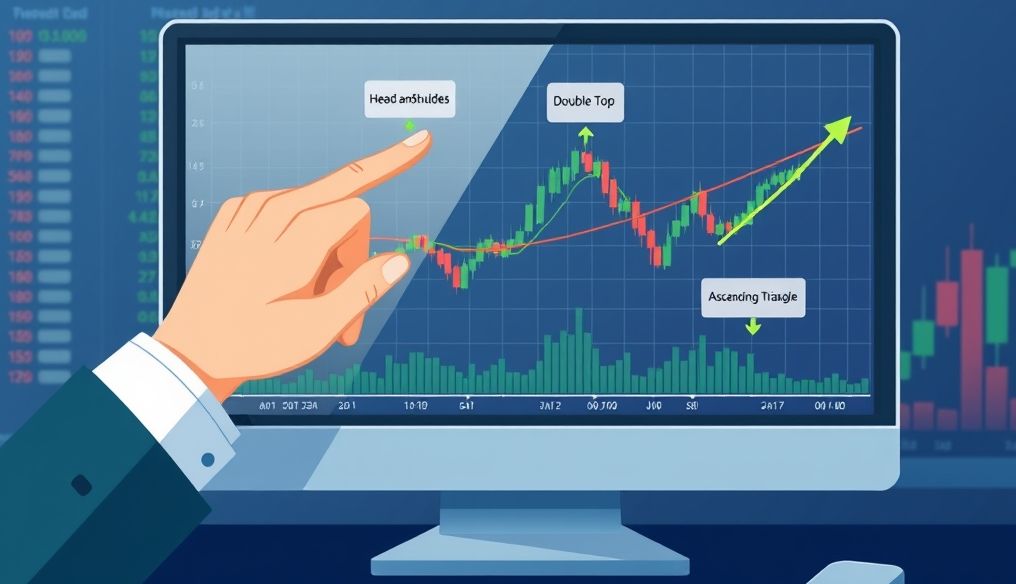
Chapter 2: Types of Classical Chart Patterns
There are two main types of classical chart patterns:
- Continuation Patterns: Indicate that the current trend is likely to continue.
- Reversal Patterns: Indicate that the current trend is likely to reverse.
We will explore some of the most important of these patterns in detail.
Chapter 3: Continuation Patterns: Triangles
Triangles are common continuation patterns that appear when the price range narrows. There are three main types:
- Ascending Triangle: Characterized by a horizontal resistance line and an ascending support line. Indicates a potential continuation of the upward trend.
- Descending Triangle: Characterized by a horizontal support line and a descending resistance line. Indicates a potential continuation of the downward trend.
- Symmetrical Triangle: Characterized by a descending resistance line and an ascending support line. Indicates a potential continuation of the existing trend, but it is less clear than the ascending and descending triangles.
Practical Example: Suppose that Saudi Aramco's stock forms an ascending triangle on the daily chart. If the price breaks through the horizontal resistance line, it could be a buy signal.
Chapter 4: Continuation Patterns: Flags and Pennants
Flags and pennants are short-term continuation patterns that indicate a temporary pause in the trend before it resumes.
- Flag: Appears as a small corrective pattern that slopes against the direction of the main trend.
- Pennant: Appears as a corrective pattern that gradually narrows in the direction of the main trend.
Practical Example: If SABIC's stock is in an uptrend and forms a bearish flag, it could be a signal that the uptrend will resume soon.
Chapter 5: Reversal Patterns: Head and Shoulders
The head and shoulders pattern is a major reversal pattern that indicates the end of an uptrend and the beginning of a downtrend.
- Head: The highest peak in the pattern.
- Shoulders: Two smaller peaks on either side of the head.
- Neckline: A line connecting the troughs between the shoulders and the head.
Practical Example: If a head and shoulders pattern appears on the weekly chart of Al Rajhi Bank's stock, it could be a signal that the stock is about to enter a downtrend.
Chapter 6: Reversal Patterns: Double Top and Double Bottom
Double top and double bottom are reversal patterns that indicate the end of a trend and the beginning of a new trend.
- Double Top: Forms when the price reaches two consecutive peaks at approximately the same level.
- Double Bottom: Forms when the price reaches two consecutive troughs at approximately the same level.
Practical Example: If a double bottom appears on the daily chart of oil prices, it could be a signal that the oil price is about to rise.
Chapter 7: Volume and Confirmation
Volume is an important indicator to consider when analyzing chart patterns. A breakout accompanied by high trading volume is usually more reliable than a breakout accompanied by low trading volume.
Example: If a stock breaks through the resistance line of an ascending triangle with high trading volume, this reinforces the buy signal.
Chapter 8: Risk Management
Risk management is an essential part of successful trading. Traders should always set stop-loss points before entering any trade.
Tip: Place the stop-loss point below the support line in the case of buying, and above the resistance line in the case of selling.
Chapter 9: Combining Chart Patterns with Other Indicators
Traders can improve the accuracy of their analysis by combining chart patterns with other indicators, such as moving averages, the Relative Strength Index (RSI), and the Moving Average Convergence Divergence (MACD).
Example: If a head and shoulders pattern appears accompanied by a sell signal from the MACD indicator, it could be a strong confirmation that the stock is about to decline.
Chapter 10: Tips for Traders
- Practice: Practice identifying chart patterns on historical charts before trading with real money.
- Patience: Do not rush into trades. Wait until you are sure that the chart pattern has completed.
- Discipline: Stick to your trading strategy and do not let emotions affect your decisions.
- Continuous Learning: Continue to learn more about chart patterns and technical analysis in general.
Disclaimer: Trading in financial markets involves high risks. You should consult a financial advisor before making any investment decisions.


