Introduction to Candlestick Trading
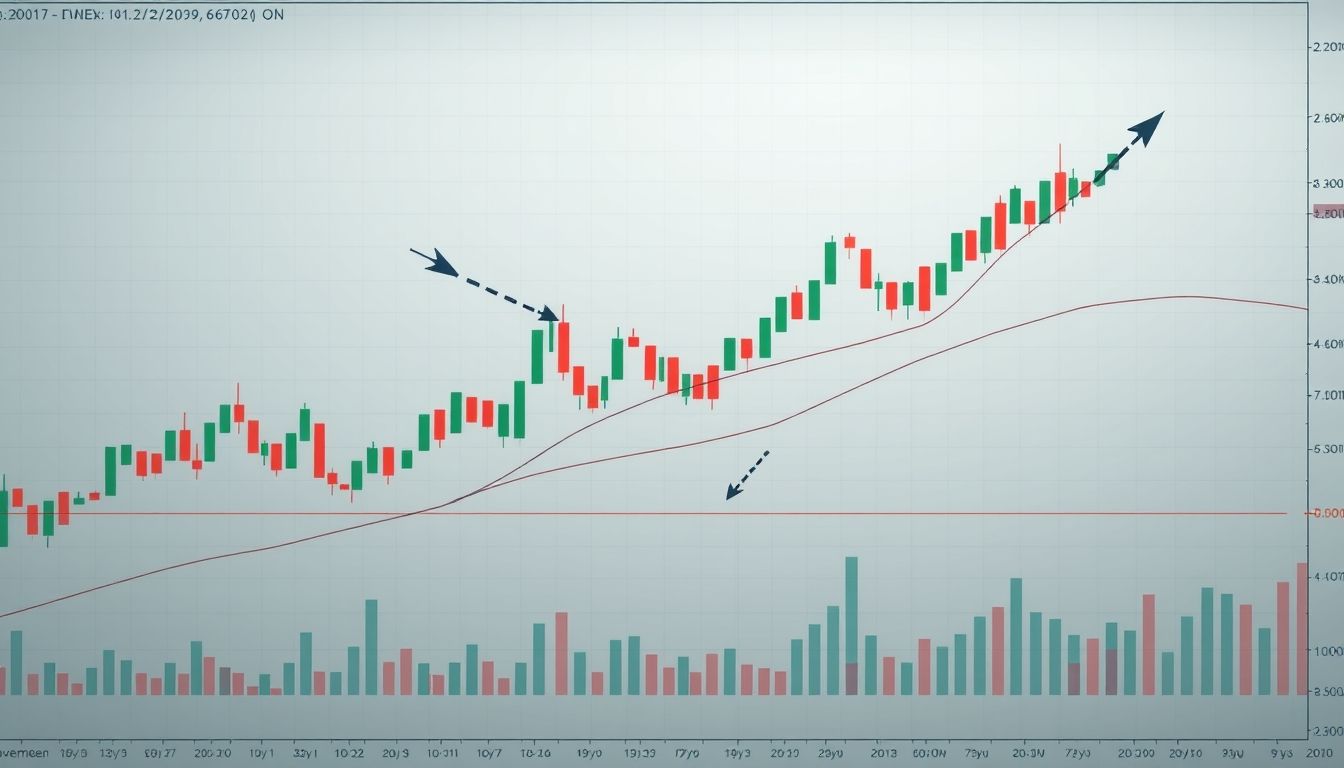
Candlesticks are a powerful tool in any trader's arsenal. These charts provide a visual representation of price movement, allowing traders to identify potential trends, reversals, and entry and exit points. In this article, we will delve into the world of candlesticks, exploring various patterns and how to use them effectively in trading strategies.
What are Candlesticks?
Candlesticks are a type of chart used in technical analysis to describe the price movement of a financial asset. Developed in Japan in the 18th century, they provide more information than a traditional line chart. Each candlestick consists of a body (representing the difference between the open and close prices) and shadows (representing the high and low prices during the period).
- Body: Represents the difference between the open and close prices. If the close price is higher than the open price, the body is usually green or white (bullish candlestick). If the close price is lower than the open price, the body is usually red or black (bearish candlestick).
- Shadows (Wicks): Extend above and below the body and represent the highest and lowest prices during the period.
Basic Candlestick Patterns
There are several basic patterns that every trader should know:
1. Hammer and Hanging Man
These patterns have small bodies and long lower shadows. The hammer appears at the end of a downtrend and indicates a potential reversal. The hanging man appears at the end of an uptrend and also indicates a potential reversal. These patterns must be confirmed with a subsequent candlestick.
2. Shooting Star and Inverted Hammer
These patterns have small bodies and long upper shadows. The shooting star appears at the end of an uptrend and indicates a potential reversal. The inverted hammer appears at the end of a downtrend and also indicates a potential reversal. These patterns must be confirmed with a subsequent candlestick.
3. Doji
A doji occurs when the open and close prices are nearly equal. A doji indicates indecision in the market and can be a sign of a potential reversal, especially if it appears after a series of bullish or bearish candlesticks.
4. Engulfing
Engulfing patterns occur when one candlestick "engulfs" the previous candlestick. There are two types:
- Bullish Engulfing: A bullish candlestick engulfs the previous bearish candlestick, indicating a potential bullish reversal.
- Bearish Engulfing: A bearish candlestick engulfs the previous bullish candlestick, indicating a potential bearish reversal.
Advanced Candlestick Trading Strategies
1. Using Candlesticks with Support and Resistance Levels
Candlestick patterns can be combined with support and resistance levels to identify high-probability trading opportunities. For example, if a hammer candlestick appears at a support level, it could be a strong buy signal.
2. Using Candlesticks with Technical Indicators
Candlesticks can be used with other technical indicators, such as moving averages and the Relative Strength Index (RSI), to confirm signals. For example, if a bullish engulfing candlestick appears and the RSI indicates that the asset is in oversold territory, it could be a strong buy signal.
3. Trading with Multiple Candlestick Patterns
Instead of relying on a single candlestick, traders can look for patterns that consist of multiple candlesticks. For example:
- Morning Star: A bullish reversal pattern consisting of three candlesticks: a large bearish candlestick, a small candlestick (doji or small-bodied candlestick), and a large bullish candlestick.
- Evening Star: A bearish reversal pattern consisting of three candlesticks: a large bullish candlestick, a small candlestick (doji or small-bodied candlestick), and a large bearish candlestick.
Real-World Examples from Arab and Global Markets
Example 1: Saudi Aramco (2222.SR) Stock
In a technical analysis of Saudi Aramco stock on the daily timeframe, a hammer candlestick appeared at a key support level. Subsequently, the stock rose significantly, confirming the effectiveness of this pattern.
Example 2: EUR/USD Currency Pair
On the weekly timeframe, a bearish engulfing pattern appeared after a period of rising prices. This was followed by a sharp decline in the value of the Euro against the US Dollar, demonstrating the strength of this pattern.
Risk Management in Candlestick Trading
Regardless of the strategy used, it is essential to manage risk effectively. Risk management includes setting appropriate stop-loss and take-profit levels, and determining the appropriate trade size.
Risk Management Tips:
- Set Stop-Loss Orders: Place a stop-loss order to protect your capital in case the market moves against you.
- Set Take-Profit Orders: Determine a take-profit level to capture targeted profits.
- Trade Size: Do not risk more than 1-2% of your capital on any single trade.
Common Mistakes to Avoid
Many traders make common mistakes when using candlesticks. These mistakes include:
- Relying on a Single Pattern: Patterns should be confirmed with subsequent candlesticks or other technical indicators.
- Not Considering the Overall Market Context: Patterns should be analyzed in the context of the overall market trend.
- Not Managing Risk Effectively: Appropriate stop-loss and take-profit levels should be set.
Conclusion
Candlestick trading is a powerful technique that can help traders make informed decisions. By understanding the different patterns and how to use them effectively, traders can improve their chances of success. However, it is essential to manage risk effectively and avoid common mistakes.
Disclaimer: Trading in financial markets involves high risks. This article is for educational purposes only and should not be considered investment advice. Consult a financial advisor before making any investment decisions.


