مقدمة إلى نظرية موجات إليوت
تعتبر نظرية موجات إليوت من الأدوات الهامة لتحليل الأسواق المالية، حيث تساعد المتداولين على فهم دورات السوق والتنبؤ بالاتجاهات المستقبلية. تم تطوير هذه النظرية في ثلاثينيات القرن الماضي بواسطة رالف نيلسون إليوت، وتعتمد على فكرة أن الأسواق تتحرك في أنماط متكررة تعرف بالموجات.
الفصل الأول: أساسيات نظرية موجات إليوت
1.1 ما هي موجات إليوت؟
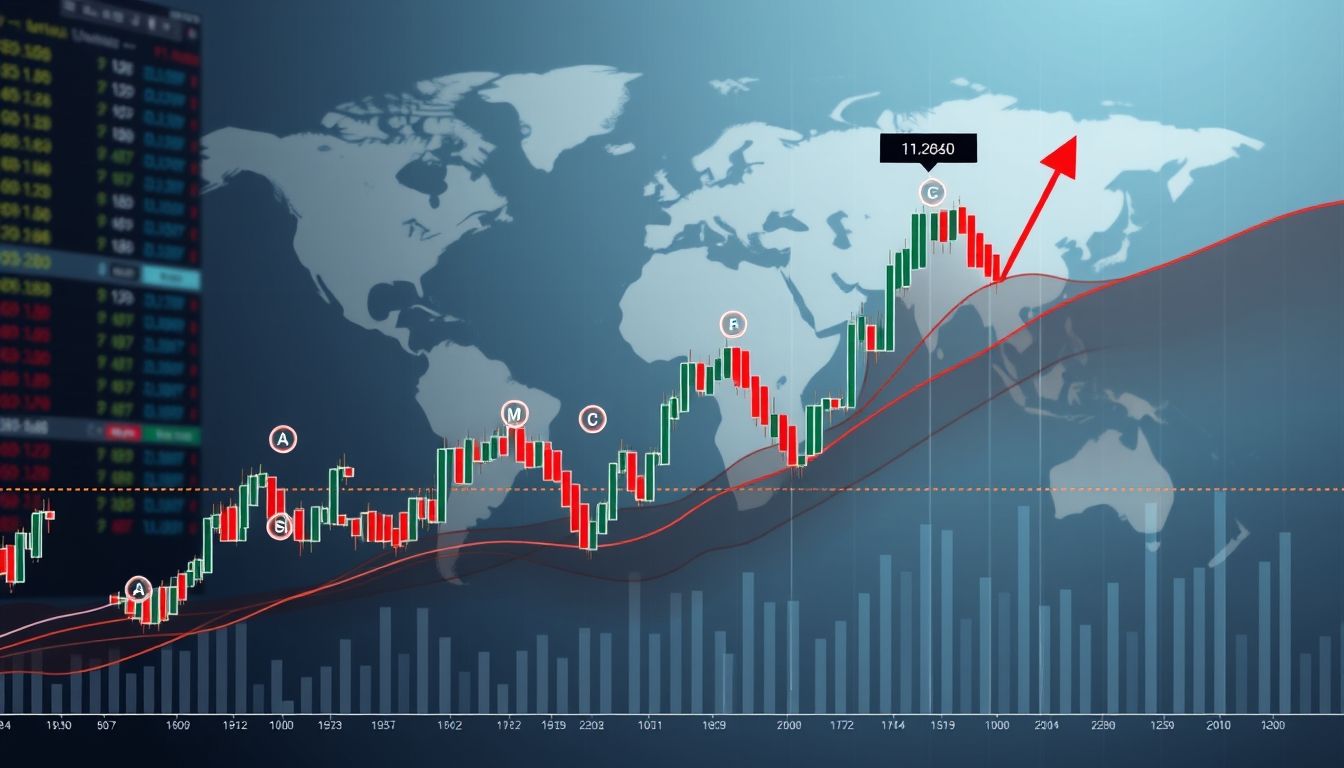
تتكون موجات إليوت من نمطين رئيسيين: الموجات الدافعة والموجات التصحيحية. الموجات الدافعة تتكون من خمس موجات، بينما الموجات التصحيحية تتكون من ثلاث موجات.
1.2 الموجات الدافعة (Impulse Waves)
تتحرك الموجات الدافعة في اتجاه الاتجاه السائد، وتتكون من خمس موجات مرقمة من 1 إلى 5. تتضمن هذه الموجات:
- الموجة 1: بداية الاتجاه الجديد.
- الموجة 2: تصحيح للموجة 1، وعادة ما تكون ضحلة.
- الموجة 3: أقوى الموجات، وتتجاوز قمة الموجة 1.
- الموجة 4: تصحيح للموجة 3، وعادة ما تكون معقدة.
- الموجة 5: نهاية الاتجاه الدافعة، وقد تكون ممتدة أو مقطوعة.
1.3 الموجات التصحيحية (Corrective Waves)
تتحرك الموجات التصحيحية عكس الاتجاه السائد، وتتكون من ثلاث موجات مرقمة A، B، و C. تتضمن هذه الموجات:
- الموجة A: تصحيح للموجات الدافعة.
- الموجة B: ارتداد مؤقت.
- الموجة C: نهاية التصحيح، وعادة ما تكون قوية.
الفصل الثاني: قواعد وإرشادات موجات إليوت
2.1 القواعد الأساسية
توجد ثلاث قواعد أساسية يجب الالتزام بها عند تطبيق نظرية موجات إليوت:
- الموجة 2 لا تتجاوز بداية الموجة 1.
- الموجة 3 لا تكون الأقصر بين الموجات الدافعة (1، 3، 5).
- الموجة 4 لا تتداخل مع منطقة الموجة 1.
2.2 الإرشادات الهامة
بالإضافة إلى القواعد، توجد بعض الإرشادات التي تساعد في تحديد الموجات بشكل صحيح:
- الموجة 3 غالباً ما تكون الأطول والأقوى.
- الموجة 5 قد تكون ممتدة (Extended) أو مقطوعة (Truncated).
- الموجات التصحيحية غالباً ما تكون معقدة وتتخذ أشكالاً مختلفة مثل الزجزاج، المسطحة، والمثلثات.
الفصل الثالث: نسب فيبوناتشي في موجات إليوت
3.1 استخدام نسب فيبوناتشي
تعتبر نسب فيبوناتشي أداة قوية لتحديد مستويات الدعم والمقاومة المحتملة في موجات إليوت. تشمل النسب الهامة:
- 38.2%، 50%، 61.8%: مستويات تصحيح محتملة للموجات.
- 161.8%، 261.8%: مستويات امتداد محتملة للموجات.
3.2 تطبيق نسب فيبوناتشي على الموجات الدافعة
يمكن استخدام نسب فيبوناتشي لتحديد أهداف الموجات الدافعة. على سبيل المثال، يمكن توقع أن تمتد الموجة 3 بنسبة 161.8% من طول الموجة 1.
3.3 تطبيق نسب فيبوناتشي على الموجات التصحيحية
يمكن استخدام نسب فيبوناتشي لتحديد مستويات التصحيح المحتملة. على سبيل المثال، يمكن توقع أن تصحح الموجة 2 بنسبة 38.2% أو 50% من طول الموجة 1.
الفصل الرابع: أنماط الموجات التصحيحية
4.1 الزجزاج (Zigzag)
يتكون الزجزاج من ثلاث موجات (A-B-C) حيث تكون الموجة B أقل من بداية الموجة A.
4.2 المسطحة (Flat)
تتكون المسطحة من ثلاث موجات (A-B-C) حيث تكون الموجة B قريبة من بداية الموجة A.
4.3 المثلثات (Triangles)
تتكون المثلثات من خمس موجات (A-B-C-D-E) وتتميز بتقلص النطاق السعري.
الفصل الخامس: تحديد الموجات في الرسوم البيانية
5.1 تحليل الرسوم البيانية
يتطلب تحديد الموجات في الرسوم البيانية ممارسة وخبرة. يجب البحث عن الأنماط المتكررة وتطبيق القواعد والإرشادات.
5.2 استخدام المؤشرات الفنية
يمكن استخدام المؤشرات الفنية مثل المتوسطات المتحركة، مؤشر القوة النسبية (RSI)، ومؤشر الماكد (MACD) لتأكيد التحليل الموجي.
الفصل السادس: استراتيجيات التداول باستخدام موجات إليوت
6.1 استراتيجية الدخول والخروج
يمكن استخدام موجات إليوت لتحديد نقاط الدخول والخروج المثالية. على سبيل المثال، يمكن الدخول في صفقة شراء عند بداية الموجة 3 والخروج عند نهاية الموجة 5.
6.2 إدارة المخاطر
تعتبر إدارة المخاطر جزءاً حيوياً من أي استراتيجية تداول. يجب تحديد مستويات وقف الخسارة وجني الأرباح بناءً على التحليل الموجي.
الفصل السابع: أمثلة عملية من السوق العربي
7.1 تحليل سهم أرامكو
مثال على كيفية تطبيق نظرية موجات إليوت على سهم أرامكو لتحديد الاتجاهات المستقبلية.
7.2 تحليل المؤشر العام السعودي (تاسي)
تحليل موجي للمؤشر العام السعودي لتحديد مستويات الدعم والمقاومة المحتملة.
الفصل الثامن: أمثلة عملية من الأسواق العالمية
8.1 تحليل مؤشر S&P 500
تحليل موجي لمؤشر S&P 500 لتحديد الاتجاهات المستقبلية في السوق الأمريكي.
8.2 تحليل زوج العملات EUR/USD
تحليل موجي لزوج العملات EUR/USD لتحديد فرص التداول المحتملة.
الفصل التاسع: الأخطاء الشائعة في تطبيق نظرية موجات إليوت
9.1 التفسير الخاطئ للموجات
أحد الأخطاء الشائعة هو التفسير الخاطئ للموجات بسبب عدم الالتزام بالقواعد والإرشادات.
9.2 تجاهل إدارة المخاطر
تجاهل إدارة المخاطر يمكن أن يؤدي إلى خسائر كبيرة. يجب دائماً تحديد مستويات وقف الخسارة وجني الأرباح.
الفصل العاشر: نصائح لتحسين مهارات التداول باستخدام موجات إليوت
10.1 الممارسة المستمرة
الممارسة المستمرة هي المفتاح لتحسين مهارات التداول باستخدام موجات إليوت. يجب تحليل الرسوم البيانية بانتظام وتطبيق الاستراتيجيات المختلفة.
10.2 التعلم من الخبراء
يمكن الاستفادة من خبرة المتداولين المحترفين من خلال حضور الدورات التدريبية وقراءة الكتب والمقالات.
إخلاء المسؤولية: هذا المقال لأغراض تعليمية فقط ولا يعتبر نصيحة استثمارية.


