MACD: Your Comprehensive Guide to Profitable Trading Strategies
The Moving Average Convergence Divergence (MACD) is one of the most popular and widely used technical indicators in the trading world. This indicator provides valuable insights into price momentum and direction, helping traders make informed decisions. In this article, we will delve deeply into MACD trading strategies, from the basics to advanced techniques.
Chapter 1: Understanding the MACD Indicator
The MACD is a momentum indicator that shows the relationship between two moving averages of an asset's price. It was developed by Gerald Appel in the late 1970s. The indicator consists of three main elements:
- MACD Line: The difference between two Exponential Moving Averages (EMAs), typically 12-day and 26-day.
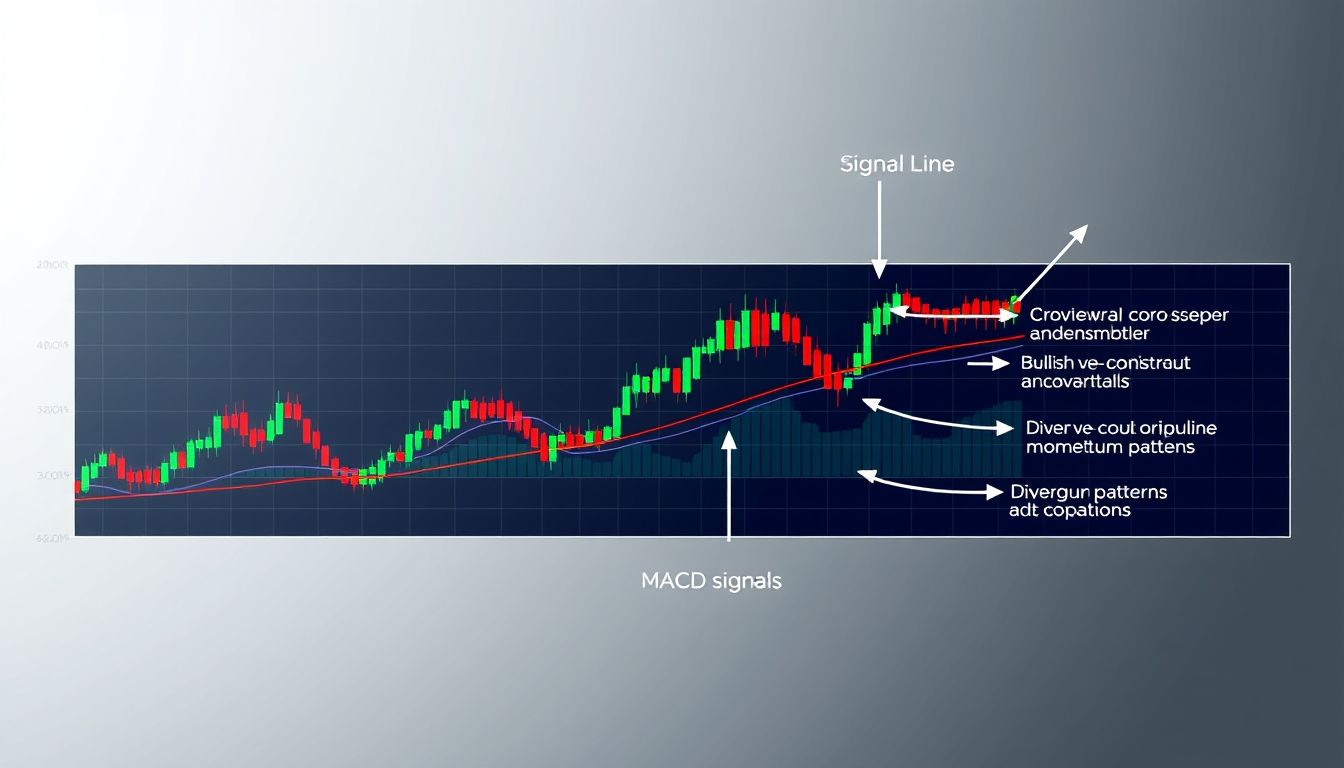
- Signal Line: An EMA of the MACD line, typically 9-day.
- Histogram: Represents the difference between the MACD line and the Signal Line.
Calculating the MACD:
- Calculate the 12-day Exponential Moving Average (EMA12).
- Calculate the 26-day Exponential Moving Average (EMA26).
- Calculate the MACD Line: MACD = EMA12 - EMA26
- Calculate the Signal Line (usually EMA9 of the MACD line).
- Calculate the Histogram: Histogram = MACD - Signal Line
Illustrative Example:
Let's assume the price of "Apple" stock has been fluctuating around $150. After calculating the moving averages, we find that EMA12 = $150.5 and EMA26 = $149.8. Therefore, the MACD Line = $150.5 - $149.8 = $0.7. If the Signal Line is at $0.5, then the Histogram = $0.7 - $0.5 = $0.2.
Chapter 2: Crossover Strategies
The crossover strategy is based on identifying the points where the MACD line crosses the Signal Line. These crossovers indicate potential changes in trend.
- Bullish Crossover: When the MACD line crosses above the Signal Line, it is considered a buy signal. This indicates that bullish momentum is increasing.
- Bearish Crossover: When the MACD line crosses below the Signal Line, it is considered a sell signal. This indicates that bearish momentum is increasing.
Practical Example:
In the stock market, if you notice that the MACD line for "Microsoft" stock has crossed above the Signal Line, it may be an opportunity to enter a buy trade, expecting the stock price to rise. Conversely, if the MACD line crosses below the Signal Line, it may be a signal to sell the stock.
Chapter 3: Divergence Strategy
Divergence occurs when the price of an asset moves in the opposite direction of the MACD indicator. Divergence can indicate a potential reversal in the trend.
- Bullish Divergence: Occurs when the price is in a downtrend, while the MACD indicator is forming higher lows. This suggests that the downtrend may be weakening and the price may rise soon.
- Bearish Divergence: Occurs when the price is in an uptrend, while the MACD indicator is forming lower highs. This suggests that the uptrend may be weakening and the price may fall soon.
Example:
If the S&P 500 index is making higher highs, while the MACD indicator is forming lower highs, this indicates bearish divergence, which could mean that the market is about to correct.
Chapter 4: Using the Histogram
The histogram provides additional information about the strength of the momentum. It can be used to confirm crossover and divergence signals.
- Increasing Histogram: Indicates increasing momentum in the current direction.
- Decreasing Histogram: Indicates weakening momentum in the current direction.
Practical Application:
If the MACD line has crossed above the Signal Line (buy signal), and the histogram is increasing, this confirms the strength of the signal and increases the likelihood of a successful trade.
Chapter 5: Combining MACD with Other Indicators
To improve the accuracy of MACD signals, it can be combined with other technical indicators such as:
- Relative Strength Index (RSI): To confirm overbought or oversold conditions.
- Moving Average (MA): To identify the overall trend of the market.
- Fibonacci Levels: To identify potential support and resistance levels.
Example:
If the MACD indicator is giving a buy signal, and the RSI indicator indicates that the asset is not in the overbought zone, it may be a good opportunity to enter a buy trade.
Chapter 6: Risk Management
Risk management is an essential part of any trading strategy. Stop-loss levels and take-profit targets should be set before entering any trade.
- Stop Loss: Should be placed at a level that limits potential losses if the price moves against you.
- Take Profit: Should be placed at a level where you expect the price to reach to achieve the desired profit.
Example:
If you enter a buy trade on a stock at $50, you can set the stop loss at $49 and the take profit at $52.
Chapter 7: Trading Strategies in Different Markets
The MACD indicator can be used in various financial markets, including:
- Stock Market: To identify opportunities to buy and sell stocks.
- Forex Market: To identify trading opportunities on currency pairs.
- Cryptocurrency Market: To identify trading opportunities on cryptocurrencies such as Bitcoin and Ethereum.
Strategy Adaptation:
You may need to adapt the MACD indicator settings to suit the characteristics of the market you are trading. For example, you may need to use shorter time frames in volatile markets such as the cryptocurrency market.
Chapter 8: Common Mistakes and How to Avoid Them
Common mistakes that traders make when using the MACD indicator:
- Relying on MACD alone: It should be used with other indicators to confirm signals.
- Ignoring Risk Management: Stop-loss levels and take-profit targets should always be set.
- Emotional Trading: Stick to the strategy and do not make decisions based on fear or greed.
Chapter 9: Advanced Tips
To improve your use of the MACD indicator, consider the following tips:
- Use Multiple Time Frames: Analyze the MACD on different time frames (daily, weekly, monthly) to get a clearer picture of the overall trend.
- Look for Candlestick Patterns: Candlestick patterns can help confirm MACD signals.
- Practice on a Demo Account: Before trading with real money, practice on a demo account to test your strategies.
Chapter 10: Conclusion
The MACD indicator is a powerful tool that can help traders make informed decisions. By understanding how the indicator works and using appropriate trading strategies, you can increase your chances of achieving sustainable profits in the financial markets. Remember that risk management is the key to success in trading.
Disclaimer: This article is for educational purposes only and does not constitute investment advice. Trading in financial markets carries high risks, and you may lose your capital. Consult a financial advisor before making any investment decisions.


