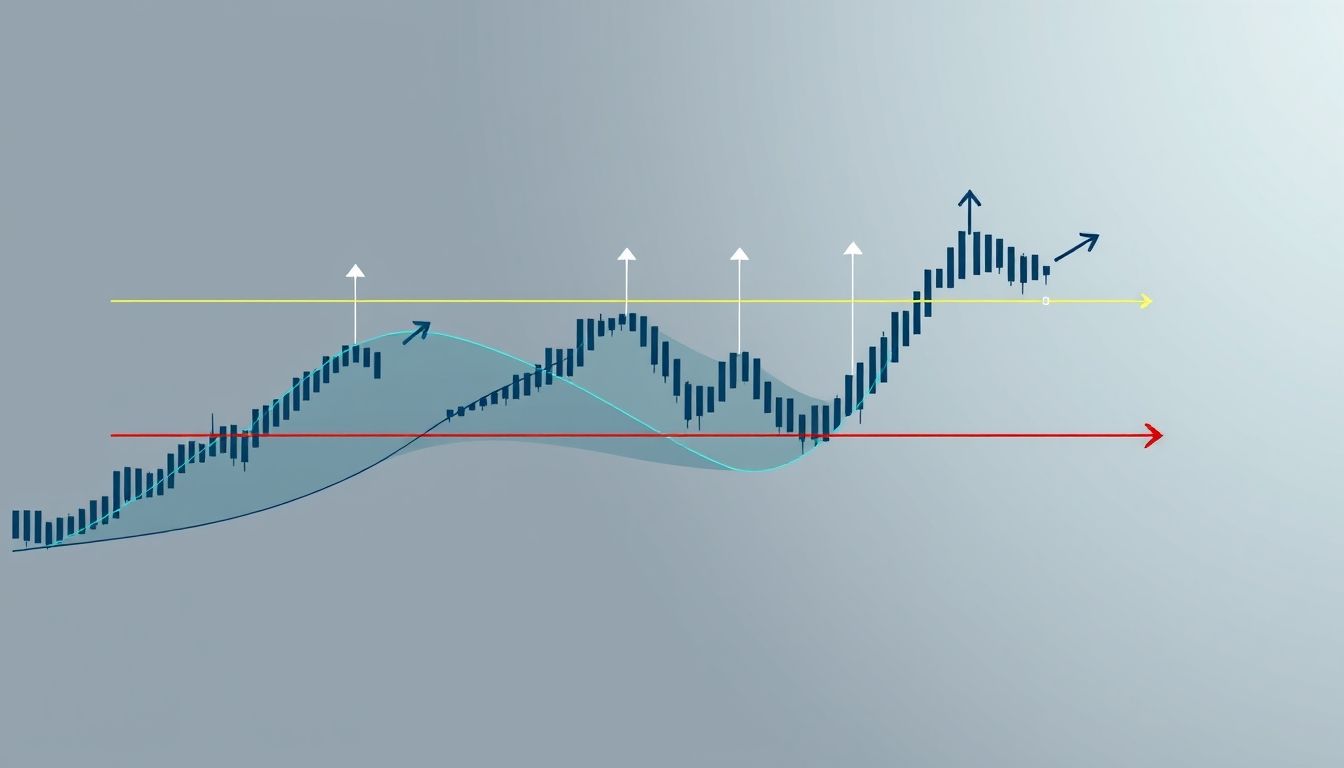
مقدمة إلى نظرية موجات إليوت
نظرية موجات إليوت هي أداة تحليل فني تستخدم لتوقع اتجاهات الأسواق المالية من خلال تحديد أنماط متكررة تسمى "الموجات". تعتمد النظرية على فكرة أن سلوك المستثمرين يتحرك في دورات نفسية جماعية، مما يخلق هذه الأنماط الموجية.
أصول نظرية موجات إليوت
تم تطوير هذه النظرية في ثلاثينيات القرن الماضي من قبل رالف نيلسون إليوت، الذي لاحظ أن الأسواق تتحرك في أنماط محددة يمكن التنبؤ بها. استند إليوت في ملاحظاته إلى بيانات سوق الأسهم على مدى 75 عامًا.
المبادئ الأساسية لموجات إليوت
تتكون نظرية موجات إليوت من نمطين رئيسيين: الموجات الدافعة (Impulse Waves) والموجات التصحيحية (Corrective Waves).
الموجات الدافعة (Impulse Waves)
تتكون الموجات الدافعة من خمس موجات فرعية، حيث تتحرك ثلاث موجات في اتجاه الاتجاه الرئيسي واثنتان في الاتجاه المعاكس. الموجات الدافعة تتبع القواعد التالية:
- الموجة 2 لا يمكن أن تتجاوز بداية الموجة 1.
- الموجة 3 لا يمكن أن تكون الأقصر بين الموجات 1 و 3 و 5.
- الموجة 4 لا يمكن أن تتداخل مع منطقة سعر الموجة 1.
الموجات التصحيحية (Corrective Waves)
تتكون الموجات التصحيحية من ثلاث موجات فرعية، وعادة ما تأتي بعد الموجات الدافعة. هناك عدة أنواع من الموجات التصحيحية، بما في ذلك:
- Zigzag: نمط تصحيحي حاد يتكون من ثلاث موجات (A-B-C).
- Flat: نمط تصحيحي جانبي يتكون من ثلاث موجات (A-B-C)، حيث تكون الموجة B قريبة من بداية الموجة A.
- Triangle: نمط تصحيحي يتكون من خمس موجات (A-B-C-D-E)، يتقارب مع مرور الوقت.
تحديد موجات إليوت على الرسم البياني
تحديد موجات إليوت على الرسم البياني يتطلب ممارسة وخبرة. من المهم البحث عن الأنماط الواضحة وتطبيق القواعد الأساسية للنظرية. يمكن استخدام أدوات التحليل الفني الأخرى، مثل خطوط الاتجاه ومؤشرات التذبذب، لتأكيد تحديد الموجات.
أمثلة عملية لتحديد الموجات
لنفترض أننا نحلل سهم شركة "أرامكو" على الرسم البياني اليومي. نلاحظ ارتفاعًا قويًا في السعر يتبعه تراجع طفيف. يمكن أن يكون هذا الارتفاع هو الموجة 1، والتراجع هو الموجة 2. إذا استمر السعر في الارتفاع بقوة، فقد يكون هذا بداية الموجة 3.
مثال آخر: إذا رأينا نمطًا تصحيحيًا حادًا بعد ارتفاع قوي، فقد يكون هذا نمط Zigzag (A-B-C) يشير إلى تصحيح مؤقت قبل استئناف الاتجاه الصعودي.
استراتيجيات التداول باستخدام موجات إليوت
بمجرد تحديد الموجات، يمكن استخدامها لتطوير استراتيجيات تداول فعالة.
الدخول والخروج من الصفقات
يمكن الدخول في صفقات شراء عند بداية الموجة 3 أو الموجة 5، حيث تكون هذه الموجات عادة الأقوى. يمكن وضع أوامر وقف الخسارة أسفل الموجة 2 لحماية رأس المال.
يمكن الدخول في صفقات بيع عند بداية الموجة التصحيحية (A-B-C)، مع وضع أوامر وقف الخسارة فوق قمة الموجة 5.
إدارة المخاطر
من الضروري إدارة المخاطر بشكل فعال عند التداول باستخدام موجات إليوت. يجب تحديد حجم الصفقة بناءً على مستوى المخاطرة المقبول، واستخدام أوامر وقف الخسارة لحماية رأس المال.
يمكن استخدام نسبة المخاطرة إلى العائد لتقييم جاذبية الصفقة. على سبيل المثال، إذا كانت نسبة المخاطرة إلى العائد 1:2، فهذا يعني أن العائد المحتمل للصفقة ضعف المخاطرة المحتملة.
أدوات التحليل الفني المساعدة
يمكن استخدام أدوات التحليل الفني الأخرى لتأكيد إشارات موجات إليوت.
مؤشرات التذبذب (Oscillators)
مؤشرات التذبذب، مثل مؤشر القوة النسبية (RSI) ومؤشر الماكد (MACD)، يمكن أن تساعد في تحديد مناطق التشبع الشرائي والتشبع البيعي، وتأكيد اتجاه السوق.
خطوط الاتجاه (Trendlines)
يمكن استخدام خطوط الاتجاه لتحديد الاتجاه الرئيسي للسوق وتأكيد الموجات. على سبيل المثال، إذا كان السعر يتحرك فوق خط اتجاه صاعد، فهذا يشير إلى اتجاه صعودي قوي.
عيوب نظرية موجات إليوت
على الرغم من فعاليتها، إلا أن نظرية موجات إليوت لها بعض العيوب.
الذاتية (Subjectivity)
تحديد الموجات يمكن أن يكون ذاتيًا، حيث قد يرى المحللون المختلفون أنماطًا مختلفة على نفس الرسم البياني. هذا يمكن أن يؤدي إلى قرارات تداول خاطئة.
التعقيد (Complexity)
نظرية موجات إليوت معقدة وتتطلب الكثير من الممارسة والخبرة لإتقانها. قد يجد المبتدئون صعوبة في فهم وتطبيق النظرية.
أمثلة من السوق العربي
يمكن تطبيق نظرية موجات إليوت على الأسواق العربية لتحليل الأسهم والعملات والسلع. على سبيل المثال، يمكن تحليل مؤشر تداول السعودي (تاسي) باستخدام موجات إليوت لتوقع اتجاه السوق.
في عام 2020، شهد مؤشر تاسي ارتفاعًا قويًا بعد جائحة كوفيد-19. يمكن تحليل هذا الارتفاع باستخدام موجات إليوت لتحديد الموجات الدافعة والتصحيحية وتوقع مستويات الدعم والمقاومة.
إحصائيات حول استخدام موجات إليوت
تشير الدراسات إلى أن استخدام نظرية موجات إليوت يمكن أن يحسن دقة التوقعات في الأسواق المالية بنسبة تتراوح بين 50% و 70%، خاصة عند دمجها مع أدوات التحليل الفني الأخرى.
وفقًا لاستطلاع رأي أجرته مجلة "فوربس"، يعتمد حوالي 30% من المتداولين المحترفين على نظرية موجات إليوت في تحليل الأسواق واتخاذ قرارات التداول.
نصائح عملية للتداول باستخدام موجات إليوت
- ابدأ بتحليل الأطر الزمنية الأكبر (الرسوم البيانية الشهرية والأسبوعية) لتحديد الاتجاه الرئيسي للسوق.
- استخدم أدوات التحليل الفني الأخرى لتأكيد إشارات موجات إليوت.
- مارس تحديد الموجات على الرسوم البيانية التاريخية قبل التداول بأموال حقيقية.
- كن صبورًا ولا تتسرع في اتخاذ القرارات.
- راجع تحليلاتك بانتظام وقم بتعديل استراتيجياتك حسب الحاجة.
"النجاح في التداول يعتمد على الصبر والانضباط والقدرة على التعلم من الأخطاء." - وارن بافيت
خلاصة
نظرية موجات إليوت هي أداة قوية لتحليل الأسواق المالية وتوقع اتجاهاتها. ومع ذلك، يجب استخدامها بحذر ودمجها مع أدوات التحليل الفني الأخرى. من خلال الممارسة والصبر، يمكن للمتداولين إتقان هذه النظرية وتحقيق أرباح مستدامة في الأسواق المالية.


