Introduction to Classical Chart Patterns
Classical chart patterns are price formations that appear on charts and help traders predict future price movements. These patterns are based on historical price analysis and the recurrence of specific formations, providing signals about potential entry and exit points in the market. They are powerful tools in any trader's arsenal, whether beginner or expert.
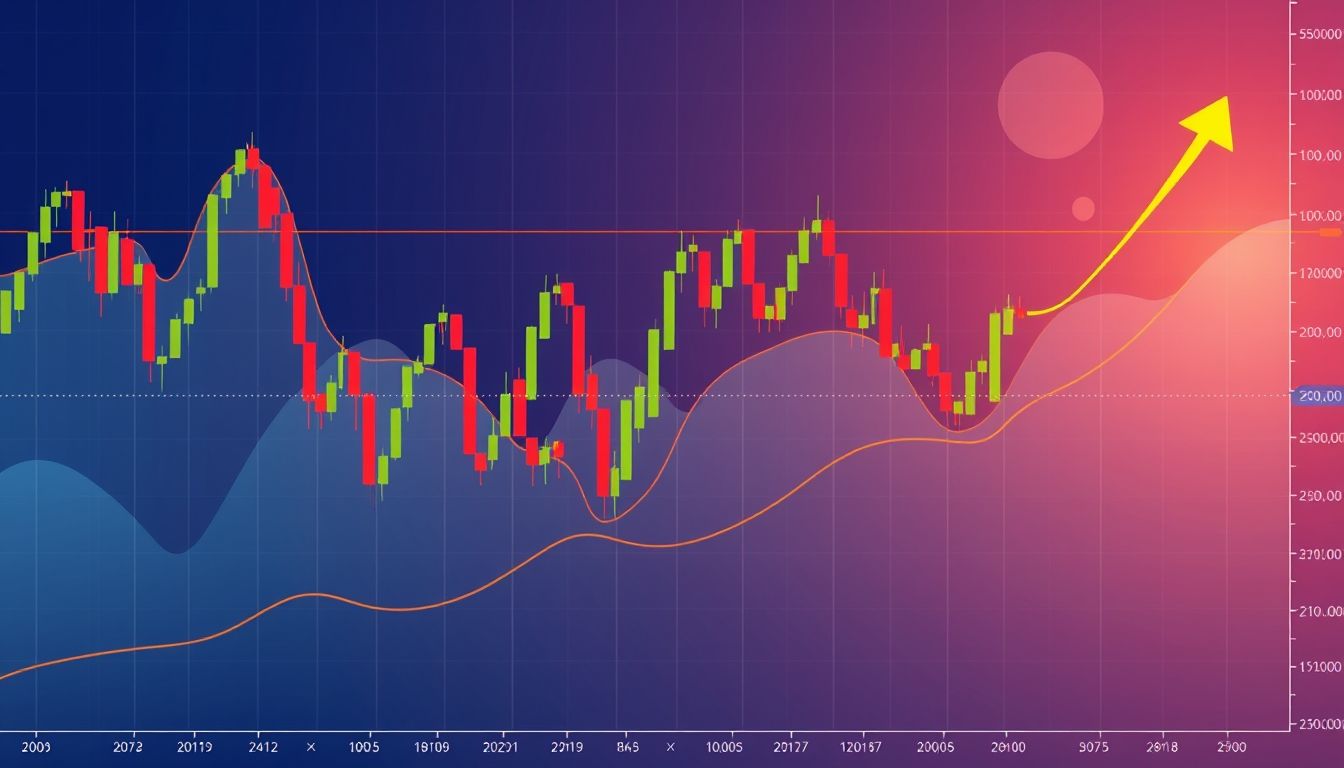
Chapter 1: Fundamentals of Technical Analysis
Technical analysis is the study of past price movements to predict future price movements. It relies on three main principles:
- The market discounts everything: All available information is reflected in the asset's price.
- Prices move in trends: Prices tend to move in clear directions (uptrend, downtrend, or sideways).
- History repeats itself: Price patterns tend to recur.
Tools of technical analysis include charts, technical indicators, and price patterns.
Chapter 2: Continuation Patterns
Continuation patterns indicate that the current price trend will continue after a period of pause or consolidation. Some common examples include:
Flag
A short-term pattern indicating the continuation of the previous trend. It consists of a strong price movement followed by a narrow consolidation period resembling a flag.
Example: A stock rises sharply and then enters a brief consolidation period, indicating that the uptrend will likely continue.
Pennant
Similar to a flag, but characterized by a consolidation period in the shape of a symmetrical triangle.
Example: The USD/JPY pair declines and then forms a pennant, suggesting a potential continuation of the downtrend.
Triangles
There are three main types of triangles: symmetrical triangle, ascending triangle, and descending triangle. The symmetrical triangle indicates a consolidation period before the trend continues, while the ascending triangle suggests an upward trend and the descending triangle suggests a downward trend.
Example: A stock index forms an ascending triangle, indicating a potential rise.
Chapter 3: Reversal Patterns
Reversal patterns indicate that the current price trend will reverse. Some common examples include:
Head and Shoulders
A bearish reversal pattern consisting of three peaks, where the middle peak (the head) is higher than the two side peaks (the shoulders). The neckline connects the troughs between the peaks.
Example: A stock forms a head and shoulders pattern, indicating a potential price decline.
Inverted Head and Shoulders
A bullish reversal pattern that is the opposite of the head and shoulders pattern.
Example: A stock forms an inverted head and shoulders pattern, indicating a potential price increase.
Double Top
A bearish reversal pattern consisting of two consecutive peaks at approximately the same level.
Example: The EUR/USD pair forms a double top, indicating a potential decline.
Double Bottom
A bullish reversal pattern consisting of two consecutive troughs at approximately the same level.
Example: A stock forms a double bottom, indicating a potential increase.
Chapter 4: Japanese Candlesticks
Japanese candlesticks are a method of representing price movement on a chart. Each candlestick represents a specific time period (day, week, month, etc.) and shows the opening price, closing price, high price, and low price.
Types of Japanese Candlesticks
- Doji: Indicates indecision in the market.
- Hammer: Indicates a potential bullish reversal.
- Hanging Man: Indicates a potential bearish reversal.
- Engulfing: Indicates a change in direction.
Example: The appearance of a hammer candlestick after a downtrend in a stock suggests a potential trend reversal.
Chapter 5: Using Technical Indicators with Patterns
The effectiveness of chart patterns can be enhanced by using technical indicators. Some common indicators include:
- Moving Averages: Help identify the overall trend of the price.
- Relative Strength Index (RSI): Measures the strength of the trend and identifies overbought and oversold areas.
- MACD: Measures the relationship between two moving averages.
Example: Using a 200-day moving average to confirm an uptrend in a stock in conjunction with the appearance of a flag pattern.
Chapter 6: Risk Management
Risk management is an essential part of successful trading. The appropriate trade size must be determined, and stop-loss and take-profit points must be set.
- Determine trade size: The risk in any trade should not exceed a small percentage of capital (usually 1-2%).
- Set stop-loss points: Place a stop-loss order to protect capital if the price moves against you.
- Set take-profit points: Determine the price level at which you want to take profits.
Example: If you have a trading account worth $10,000, you should not risk more than $100-200 on any trade.
Chapter 7: Trading Strategies
Developing a specific trading strategy is necessary to achieve success in the financial markets. The strategy should include clear rules for entering and exiting trades, risk management, and market analysis.
- Trend Trading Strategy: Focus on trading in the direction of the overall market trend.
- Range Trading Strategy: Focus on trading within a specific price range.
- Breakout Trading Strategy: Focus on trading when the price breaks through a resistance or support level.
Example: A trading strategy based on the head and shoulders pattern, where a sell trade is entered upon breaking the neckline with a stop loss above the right shoulder.
Chapter 8: Fundamental Analysis and Its Relationship to Chart Patterns
Fundamental analysis is the study of economic and financial factors that affect the value of an asset. Fundamental analysis can be used to confirm the signals provided by chart patterns.
- Economic News: Releases of economic data such as GDP and unemployment rates.
- Financial News: Company earnings and financial reports.
- Geopolitical Events: Political events that may affect financial markets.
Example: If a head and shoulders pattern appears in a stock and there are negative expectations for the company's earnings, this reinforces the likelihood of a price decline.
Chapter 9: Practical Examples from the Market
Analyzing real-world examples helps understand how to apply chart patterns in a trading environment.
Example 1: A stock forms a double bottom pattern on the daily chart, indicating a potential buying opportunity.
Example 2: A stock market index forms a descending triangle pattern on the weekly chart, indicating a potential decline.
Chapter 10: Tips for Traders
Tips for traders to achieve success in the financial markets:
- Continuous Education: Continue to learn more about technical analysis and financial markets.
- Practice: Practice trading using a demo account before trading with real money.
- Patience: Successful trading requires patience and commitment.
- Control Emotions: Avoid making decisions based on emotions.
- Flexibility: Be prepared to change your strategy if necessary.
Disclaimer: This article is for educational purposes only and is not investment advice.


